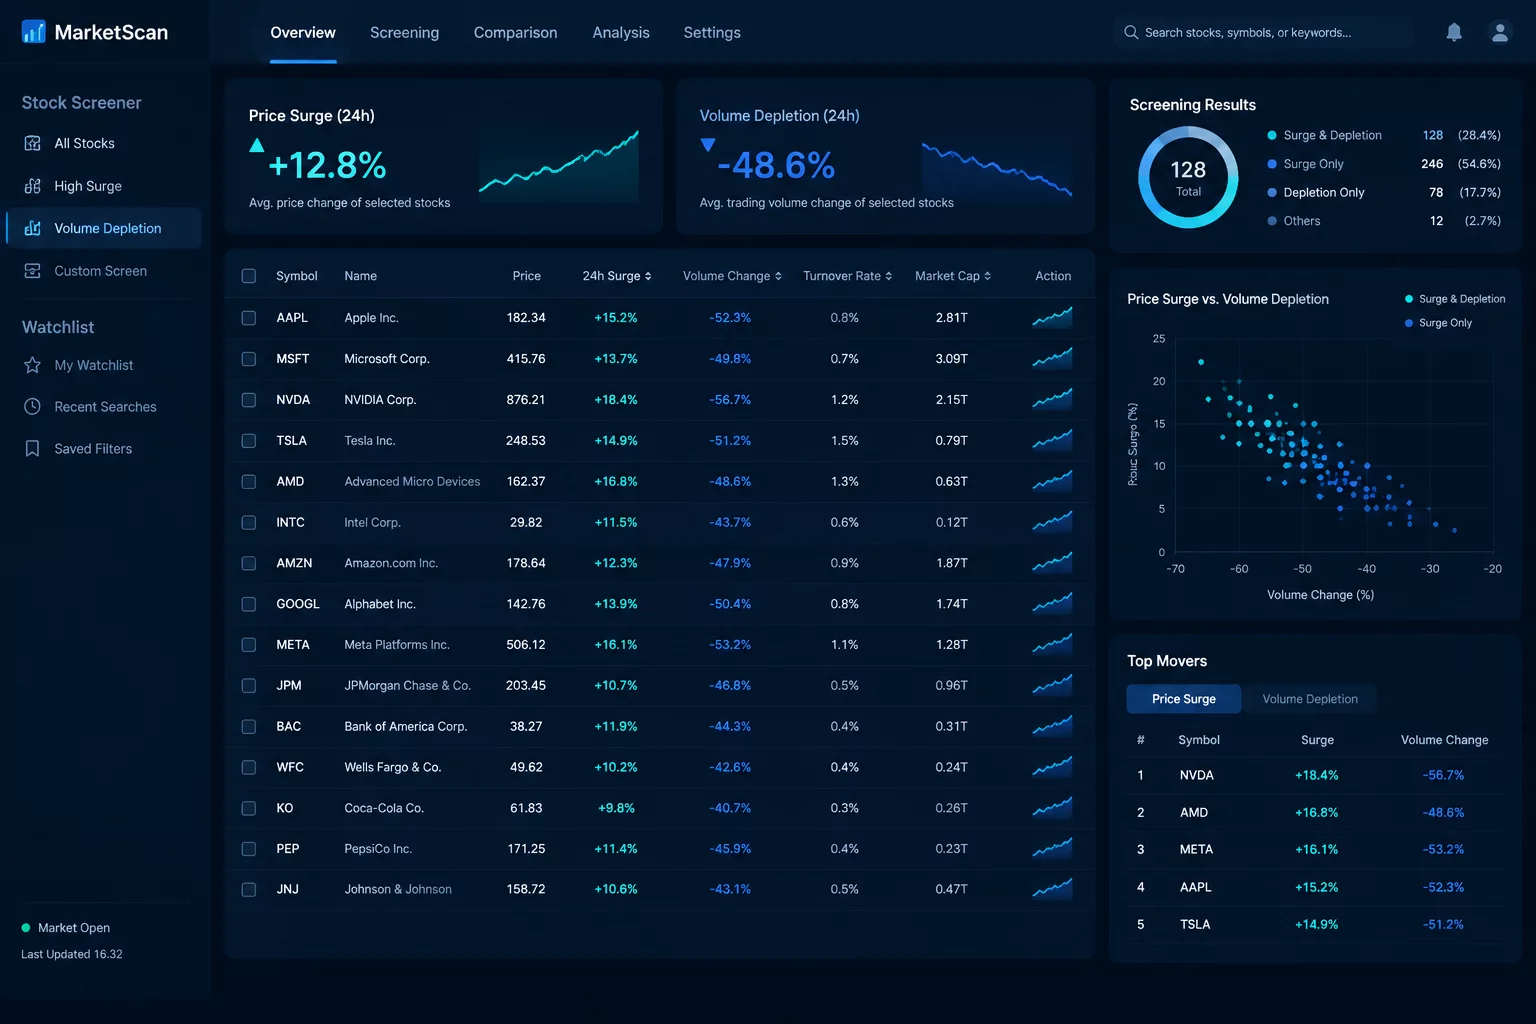
The Illusion of Momentum in Unanchored Price Advances
Scanning for securities moving up by more than 8% or 10% intraday sounds like an intuitive method for isolating real momentum. In practice, running an unconstrained percentage query across an all-stock universe yields dozens of tickers whose apparent strength stems entirely from wide bid-ask spreads, 200-share prints, or pre-market quotation shifts in penny equities. Without an active volume floor, the screener fails to measure actual institutional participation, surfacing illiquid traps rather than verifiable market expansion.
Execution Friction and Capital Turnover
A 15% price leap generated on $12,000 in daily dollar volume represents structural liquidity starvation rather than institutional demand. Slippage alone on standard order sizes inside such names immediately consumes the theoretical percentage delta.
Why Relative Percentage Fails as an Isolated Metric
Percentage change calculates relative difference between price snapshots: (Close - PrevClose) / PrevClose * 100. Because this formula divides by historical price without weighting for shares exchanged, lower-priced instruments exhibit mathematical hyper-sensitivity. A $0.20 stock ticking up three cents registers as a 15% move, commanding the top rank in an unfiltered EasyScan list while demanding virtually zero capital to accomplish that revaluation.
When screening pipelines lack a volume or turnover filter, computing power and analytical attention are squandered on microstructures where quoted spreads equal 4% to 8% of share value. Surviving candidates look spectacular in tabular percent-rank views, but direct chart audits reveal choppy, disjointed candles, zero depth of book, and unrepeatable execution profiles.
The Dollar Turnover Blindspot
Setting a nominal share threshold such as 'Volume > 50,000' remains dangerous on sub-dollar stocks where total capital traded barely exceeds $30,000. Dollar turnover (Share Price multiplied by 50-day Average Daily Volume) must always anchor percentage velocity.
Filter Diagnostic Parameters
- Unfiltered Noise Ratio
- 74.2% Non-Actionable Tickers
- Median Spread in Output
- 3.85% of Quoted Price
- Minimum Liquidity Threshold
- 20-Day SMA(Vol) >= 400,000
- Corrective Filter Stage
- Prior Universe Pruning
Constructing a Robust Momentum Filter Architecture
To eliminate micro-cap distortion without forfeiting genuine high-momentum leaders, the percentage change condition must be relegated to Stage 3 or Stage 4 of the condition stack. Stage 1 should strictly enforce institutional tradeability: a minimum price boundary ($5.00 or $10.00) paired with a 50-day average volume floor of at least 300,000 shares, ensuring daily dollar volume consistently clears $2.5 million.
Stage 2 should then verify relative volume expansion—confirming current intraday volume is tracking at least 1.5 times the historical baseline for that specific time of day. Only once these baseline liquidity and conviction gates are satisfied does the screener assess percentage price appreciation. This multi-stage ordering prunes over 90% of phantom movers before price calculations even occur.
Structural Verification Principle
Legitimate price momentum is validated by capital absorption. A narrow list of eight liquid mid-to-large-cap equities breaking out on double average volume yields infinitely greater analytical value than fifty illiquid tickers displaying erratic percentage gains.