Diagnostic Case Study

Hyper-Specific Indicator Confluence in Low Volatility

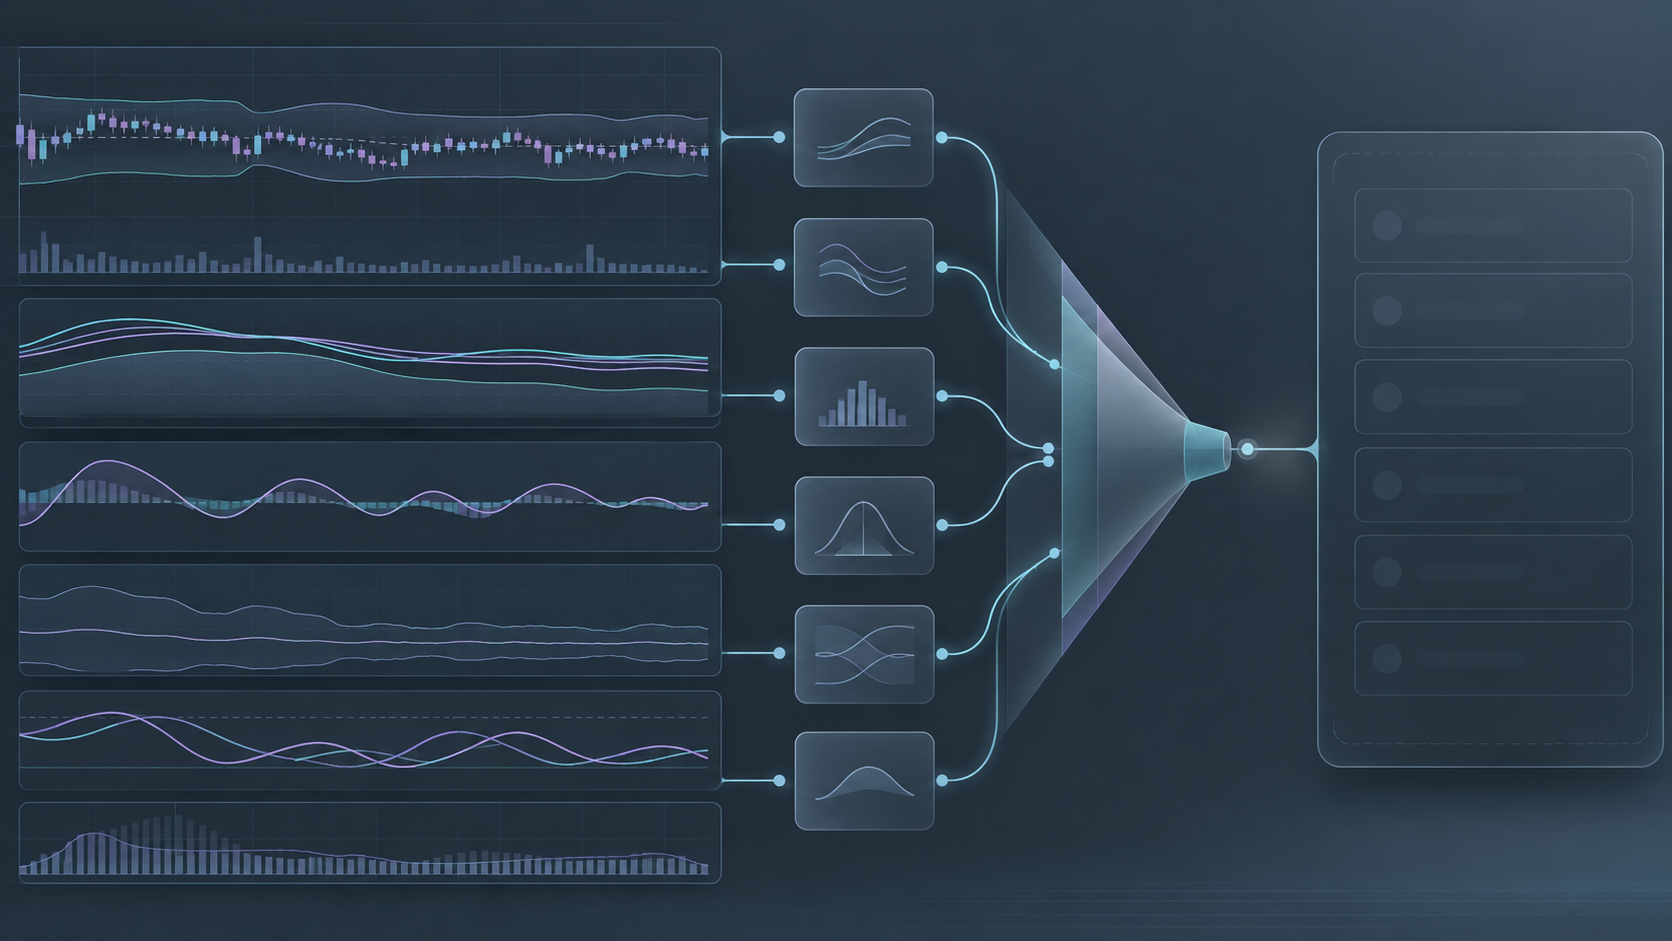
Deconstructing the mathematical paradox where stacking multiple tight oscillators during compressed volatility phases eliminates valid setups before range expansion.

2026-09-21 • Julian Hayes • 7 min read • Too-Narrow Scans
Hyper-Specific Indicator Confluence in Low Volatility
Architecture Parameters

Diagnostic Stack Architecture & Failure Mechanics

Universe Baseline
Liquid US Equities (2,450 Tickers)
Primary Choke Point
Simultaneous Stochastic & RSI Thresholds
Candidate Survival Rate
0.00% (0 of 2,450 Equities)
Recommended Remedy
Staggered Staging & Volatility Threshold Loosening
Diagnostic Breakdown

Six Structural Failures in Multi-Oscillator Confluence Stacks

Collinear Oscillation Dependency

Filtering for RSI < 32 while demanding Stochastic %K < 20 across a flat ATR environment assumes independent confirmation, but both measures sample the identical compressed close-to-close distribution.

Narrow Range Bandpass Clamping

Requiring Bollinger %B to touch 0.05 while demanding historical ATR percentiles beneath the 10th percentile creates an impossibly thin numerical boundary that noise immediately violates.

Premature Volume Surge Gating

Demanding 1.5x relative volume alongside extreme low volatility creates mutually exclusive criteria, as genuine volume expansion instantaneously inflates volatility out of the scan window.

Multi-Horizon Window Desynchronization

Overlaying daily oversold metrics with 60-minute momentum turnarounds fails in quiet tapes because intraday drift rarely syncs with daily boundary thresholds.

Zero-Candidate Sample Starvation

Over-constrained filters produce empty result sets across consecutive weeks, misleading operators into assuming no consolidations exist rather than recognizing mathematical over-filtering.

False Precision in Sub-Penny Ranges

In low volatility regimes, minor bid-ask bounce registers as massive percentage oscillations in calculated indicators, triggering erratic filter disqualification.

Technical Analysis

The Mathematical Illusion of Redundant Indicator Confirmation

Quantitative screening pipelines frequently suffer from over-engineering when designers attempt to eliminate every false positive before visual chart inspection. When market volatility compresses into multi-month lows, screener builders often stack three to five momentum and volatility indicators in an effort to isolate 'the ultimate coiling springboard'. However, each indicator formula is merely an alternate algebraic transformation of the identical four data points: open, high, low, and close.

In low volatility regimes, daily trading ranges compress to fractions of their annualized averages. When a filter requires RSI(14) to sit strictly beneath 30, Williams %R(14) to be below -80, and Stochastic Fast %K to hook upward simultaneously, it demands a synchronization that almost never occurs under tight volatility. Instead of filtering noise, the screener eliminates genuine constructive consolidations, leaving an empty results table.

Deconstructing the Confluence Trap: Step-by-Step Degradation

Testing this failure mode across a standard universe of 2,450 liquid equities illustrates how quickly compound probability decimates candidate populations:

  • Stage 1 (Liquidity & Base Price): Universal filters reduce 8,000+ issues down to 2,450 institutional-grade stocks trading above $10 with average daily turnover exceeding $5 million.
  • Stage 2 (Volatility Contraction): Applying 20-day ATR < 2nd quintile narrows the set to 490 qualifying quiet consolidations.
  • Stage 3 (Hyper-Confluence Choke): Mandating simultaneous sub-30 RSI, sub-20 Stochastic, and ADX < 15 reduces the qualifying universe from 490 to zero in a single calculation pass.

Rebalancing Filter Hierarchies for Organic Expansion Detection

To restore screening efficacy without reintroducing noise, decoupling static threshold gates is essential. Replace strict simultaneous indicator requirements with tiered sequence logic: first identify structural base compression using a single primary metric such as Keltner-Bollinger squeeze or ATR bandwidth. Reserve momentum oscillators for visual candidate review or secondary sorting rather than hard boolean gates. This methodology preserves candidate diversity while systematically preventing zero-result scan runs.

Frequently Inquired Logic

Resolving Hyper-Specific Filter Gridlocks

Topics: Indicator Confluence Low Volatility Over-Filtering Screener Optimization
Research Contributor

Julian Hayes

Julian Hayes specializes in quantitative screener architecture, market breadth data modeling, and filter sequence optimization. His research centers on eliminating algorithmic bias and parameter over-fitting in equity scanning workflows.

Diagnostic Pipeline

Diagnose Your Condition Stacks Before Live Deployment

Learn how to build resilient, multi-tiered filter pipelines that isolate institutional setups without choking candidate pipelines through redundant criteria.

Reader Questions & Case Feedback

Ask About This Screening Case

Tell us which condition or sequence you are investigating. Share a question, a correction, or a point that needs a clearer explanation.

Page reference

Hyper-Specific Indicator Confluence in Low Volatility

Our editorial desk discusses educational screening logic. It does not provide securities recommendations or trade signals.

All fields are required. Please keep your question focused on educational screening logic.

ConditionStack Journal В· Editorial Desk

Thank you for your screening question.

Your inquiry has been received along with the page reference. Thank you for helping us make screening logic clearer.