Latent Sector Concentration and Cross-Sectional Spread Audit
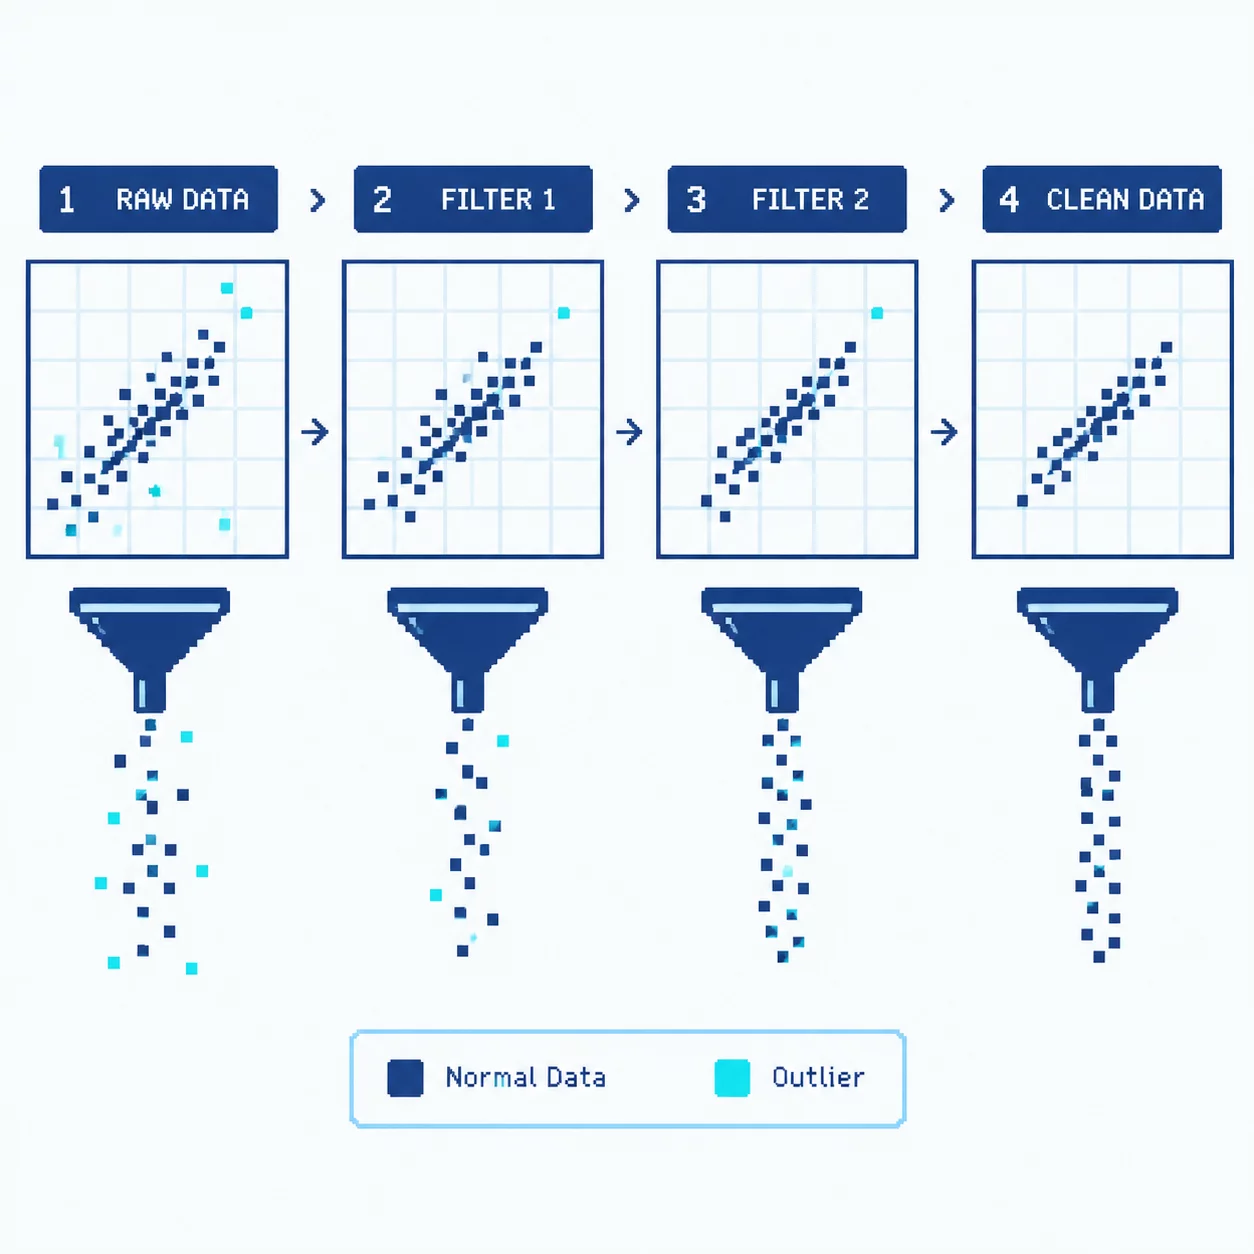
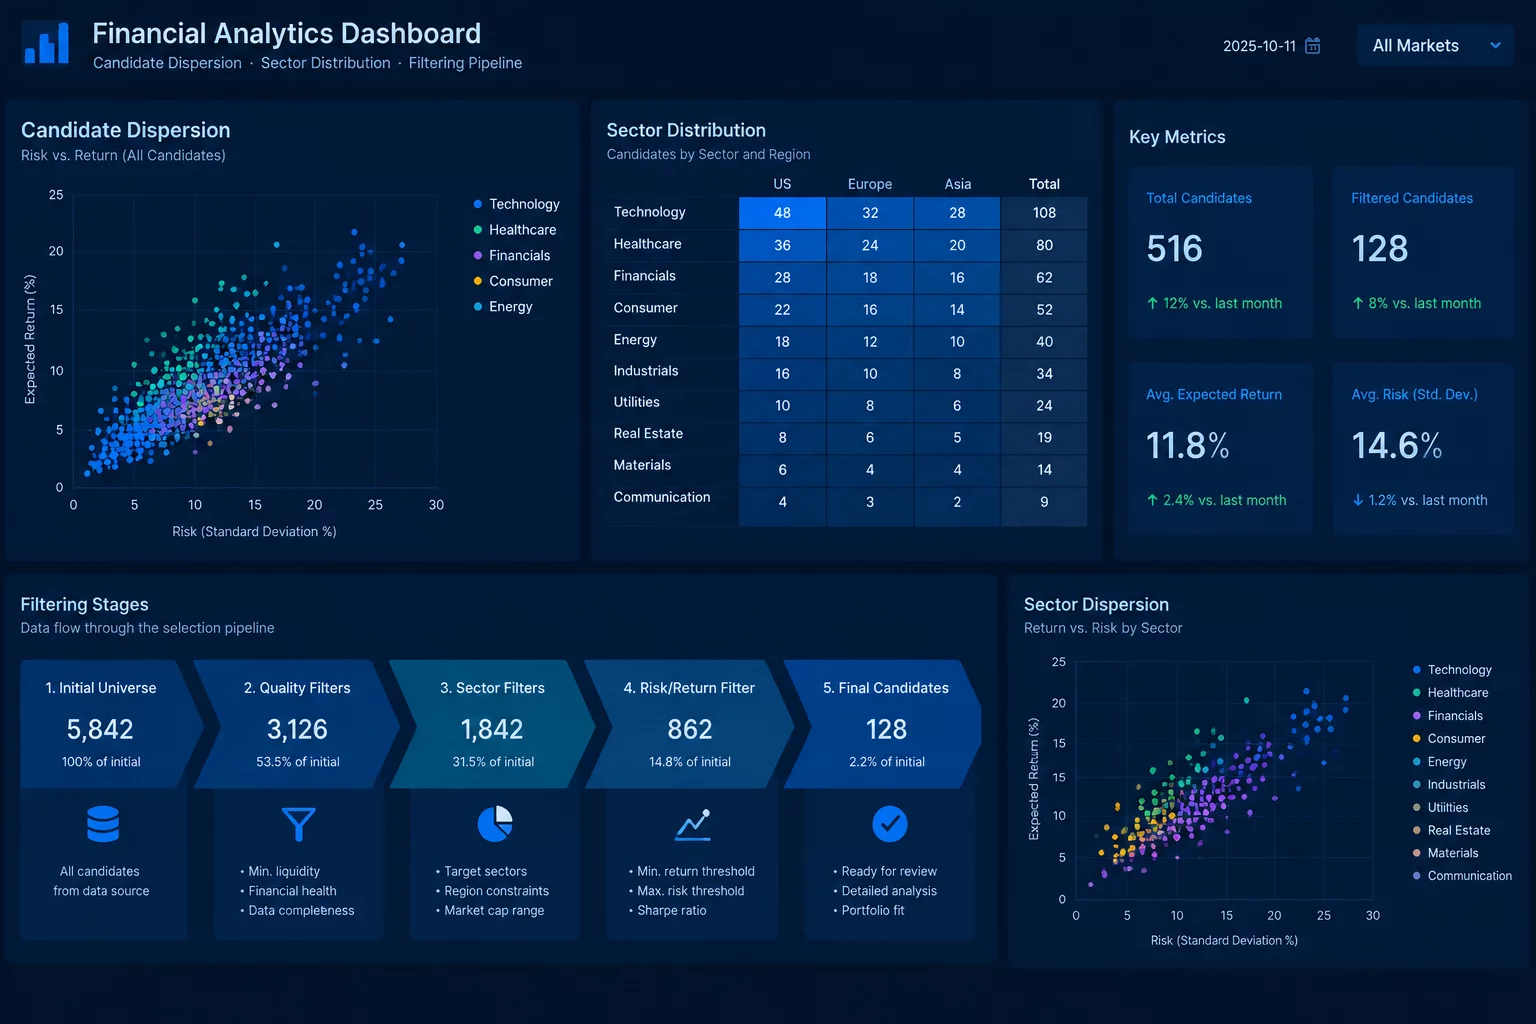
Multi-factor scans frequently filter out 98% of the initial universe while inadvertently concentrating the remaining 2% into a single cyclical industry or beta regime. This audit inspects post-screen candidate distribution across economic sectors to identify whether apparent technical setups merely reflect concentrated industry beta.
- Sample Universe:
- 4,820 Equities
- Post-Screen Output:
- 47 Candidates
- Dominant Sector Weight:
- 68.1% (Semiconductors)
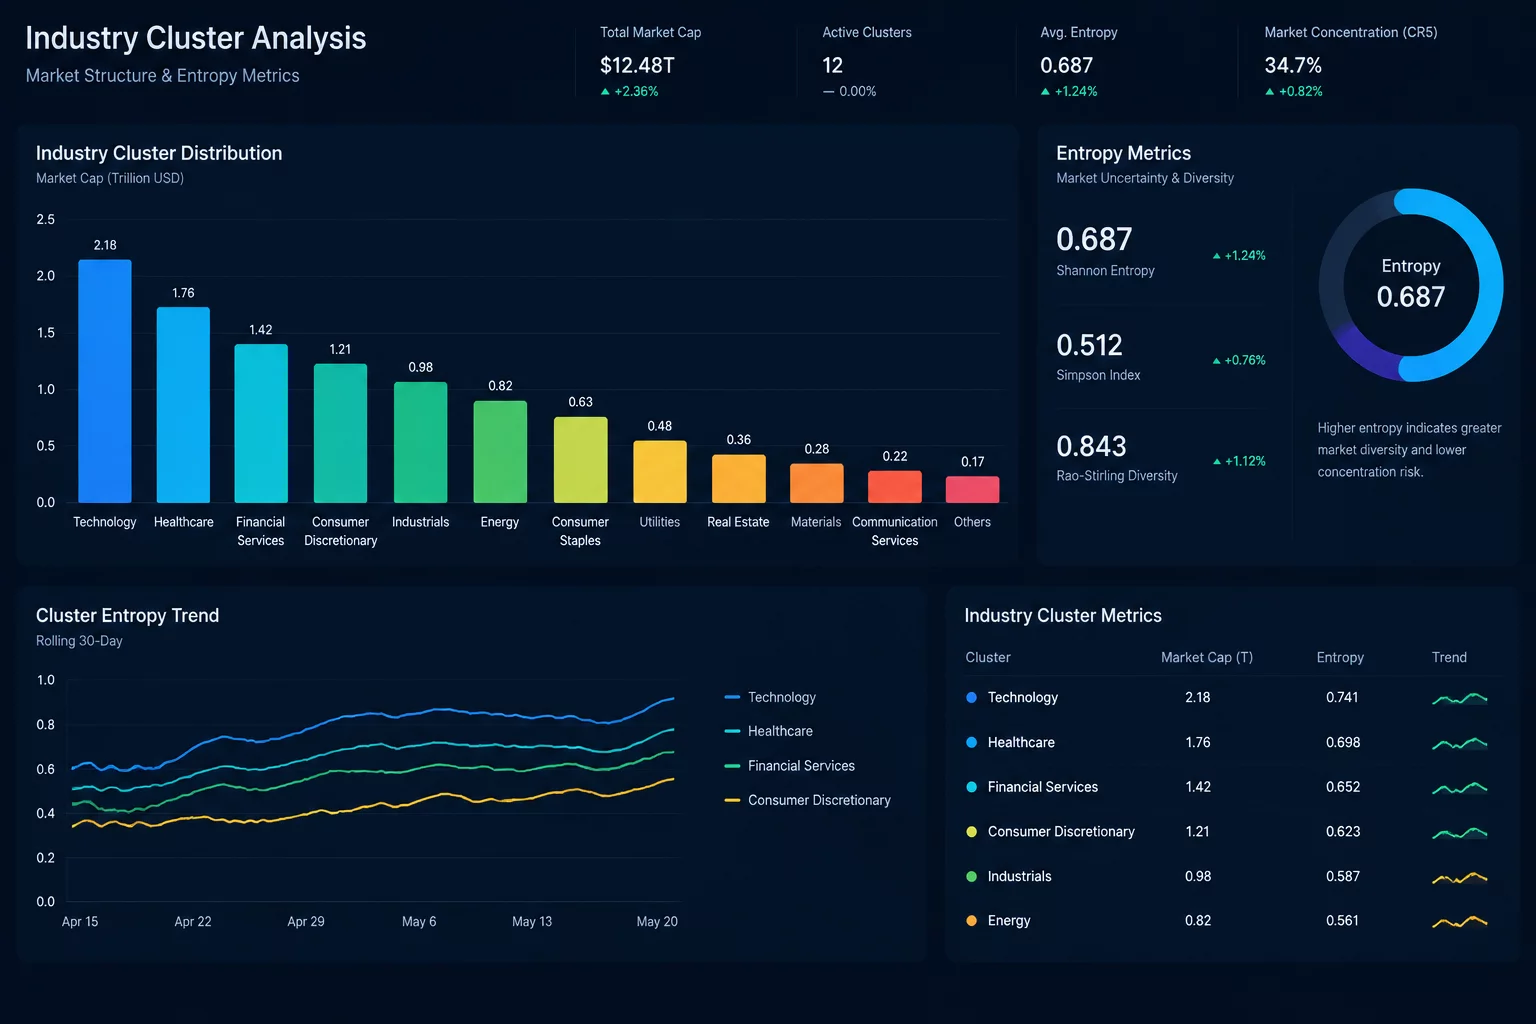
- Sector Shannon Entropy:
- 1.14 (High Clustering)
Multi-factor rules without sector normalization do not select independent setups; they primarily capture industry-level momentum co-movements.
Primary Dispersion & Concentration Diagnostics
- Narrow momentum thresholds frequently collapse universe breadth into one or two sub-industries experiencing temporary macro tailwinds.
- High post-filter correlation among candidates destroys intended portfolio diversification before any position sizing rules occur.
- Implementing dynamic group quotas or sector-standardized z-scores restores cross-sectional variety across candidate output.
Why Multi-Stage Screening Induces Accidental Sector Clustering
When quantitative researchers assemble multi-condition screening chains combining moving average alignments, relative strength thresholds, and volume spikes, they often assume the surviving pool represents idiosyncratic opportunities. However, equity performance is strongly driven by common factor exposures and sector-level beta. An unconstrained scanner applied to a wide universe inevitably clusters candidates around whichever sector is exhibiting the strongest momentum co-movement during that cycle.
If semiconductors or energy exploration equities experience an earnings impulse across the board, fifty tickers in that group will satisfy identical moving average spreads simultaneously. The scan output does not produce fifty independent trade ideas; it produces fifty manifestations of the exact same underlying factor swing, drastically increasing vulnerability to single-industry headline reversals.
Cross-Sectional Diagnostic Rule
Calculate the Herfindahl-Hirschman Index (HHI) or sector concentration ratio on your final candidate list. An HHI exceeding 2,500 indicates concentrated cluster risk rather than dispersed multi-asset candidate selection.
Mitigating Factor Skew Through Relative-to-Sector Standardization
Resolving severe candidate clustering requires modifying condition metrics from absolute market-wide thresholds to intra-sector rank evaluations. Rather than demanding an absolute 3-month rate of change above 20%, an architect evaluates tickers whose rate of change sits in the top decile relative to their specific GICS industry peer group. This relative formulation changes which companies pass within each peer group. Review whether it reduces sector concentration; it does not establish excess returns or guarantee sector neutrality.
Alternatively, introducing maximum candidate caps per industry prevents portfolio pipelines from becoming monolithic blocks. By restricting any single industry to no more than 15% of the total output pool, the analyst forces the screener to harvest the strongest representatives from defensive, healthcare, and consumer sectors alongside high-flying technology groups.
Elena Rostova
Senior Quantitative Strategist and Screener Systems Architect at ConditionStack Journal. Elena focuses on multi-factor screening mechanics, statistical pipeline validation, and cross-sectional liquidity analytics.
Related Post-Screen Review Notes & Methodologies