Multi-Factor Trend and Volume Baseline
Constructing layered momentum baselines that combine exponential moving averages with relative turnover filters for broader market screening.
How moving average spread measurement and relative volume expansion work together to isolate authentic trend acceleration from low-liquidity consolidation drift.
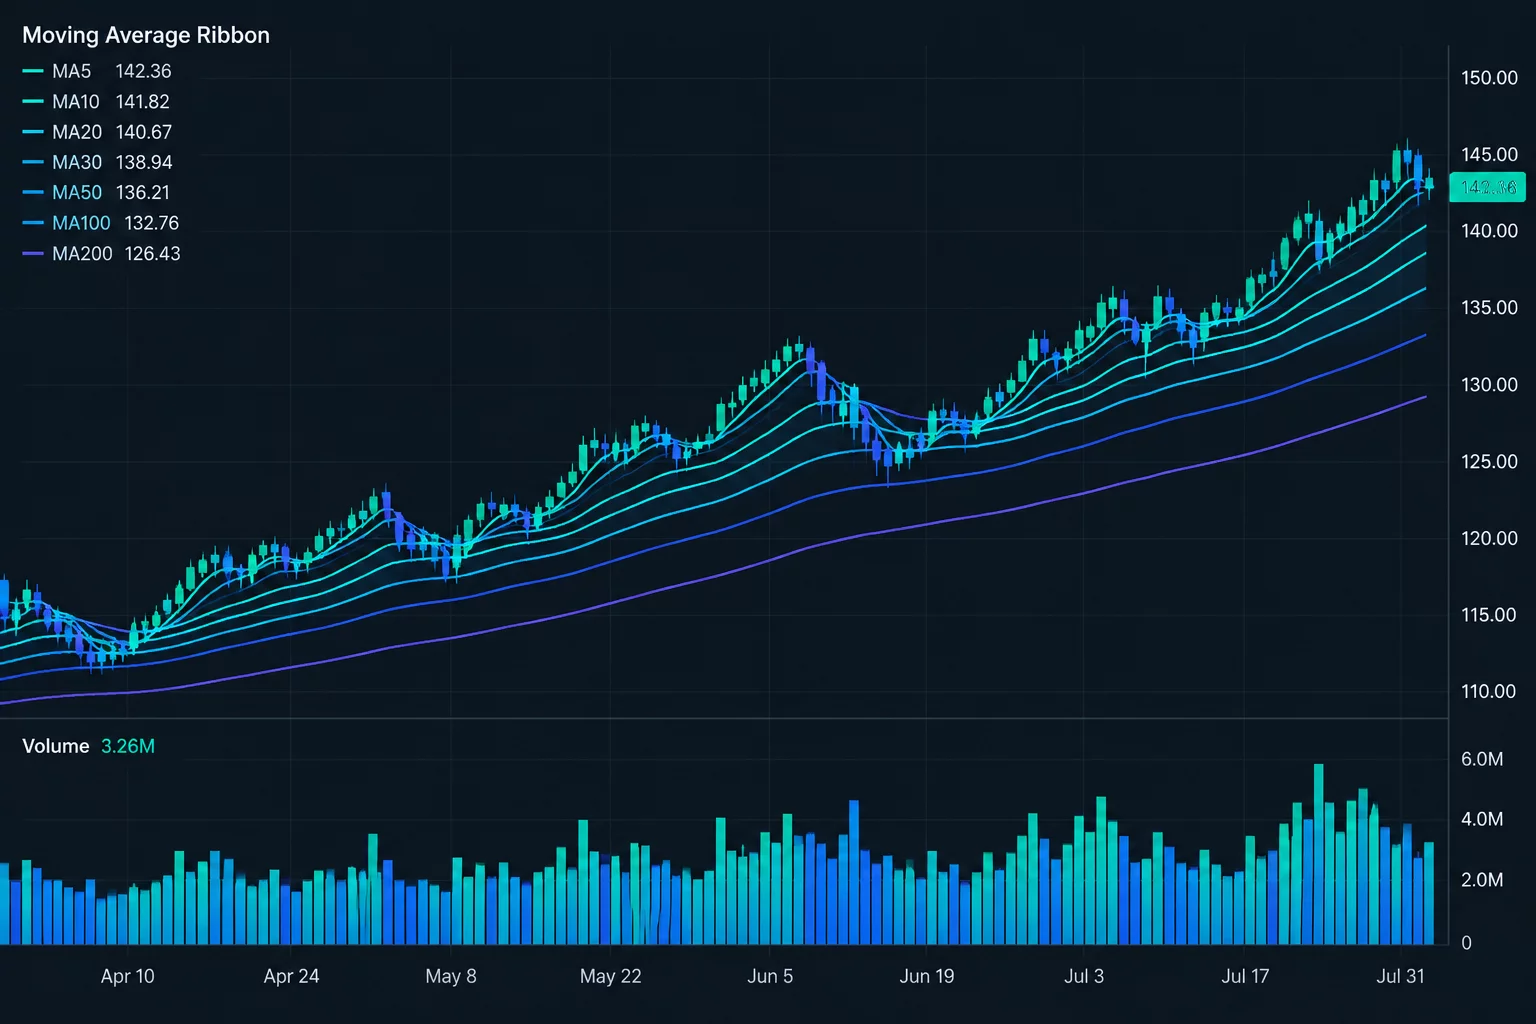
Traditional trend-following screeners rely heavily on binary moving average intersections, such as a 20-day moving average crossing above a 50-day moving average. Single-cross events happen frequently inside sideways choppy consolidation phases, triggering excessive candidate output with marginal follow-through. Moving average dispersion replaces binary crossover logic by measuring the percentage spread between tiered moving averages, ensuring that momentum expands progressively across short, intermediate, and long durations.
By calculating the relative distance between moving averages across multiple periods—such as the 10, 20, 50, and 200 sessions—the filter isolates instruments where structural alignment is widening rather than merely touching. This structural dilation confirms that price discovery is exerting consistent directional pressure over multiple participant horizons simultaneously.
Learn how to translate multi-term moving average dispersion formulas and volume expansion criteria into native TC2000 PCF syntax without bogging down system calculation throughput.
Moving average dispersion alone can produce deceptive results in low-liquidity issues or thinly traded market hours. Wide spreads between moving averages can also reflect temporary illiquid gaps. Coupling dispersion with a volume ratio filter excludes observations below the chosen activity threshold. Passing both conditions establishes a data match, not the identity or intentions of market participants.
We benchmark daily transaction volume against a 50-period average volume baseline. Requiring daily volume to surpass 1.5 times the historical median ensures the scan rejects low-volume drift. When volume spikes concurrently with moving average ribbon separation, the candidate pool shrinks from hundreds of noisy symbols down to an audited, highly concentrated cohort suitable for manual structural evaluation.
Measuring moving average spread without volume participation is like checking the speedometer while rolling downhill in neutral: speed exists, but propulsion does not.
High-beta small-cap stocks disperse faster than large-cap stalwarts. Normalize dispersion using Average True Range (ATR) or percentage ratios rather than absolute currency spreads.
Corporate actions or overnight earnings gaps can artificially warp a 50-day average volume baseline. Verify whether current volume reflects multi-session participation or a single-bar anomaly.
When market indexes experience broad trend expansions, this condition stack can output 40+ candidates simultaneously. Add an index relative strength condition or sector cap to curb market-wide redundancy.
Tell us which condition or sequence you are investigating. Share a question, a correction, or a point that needs a clearer explanation.
Moving Average Dispersion with Volume Ratio
Our editorial desk discusses educational screening logic. It does not provide securities recommendations or trade signals.