Multi-Factor Trend and Volume Baseline
A core three-tier framework filtering institutional momentum, directional trend persistence, and volume expansion thresholds.
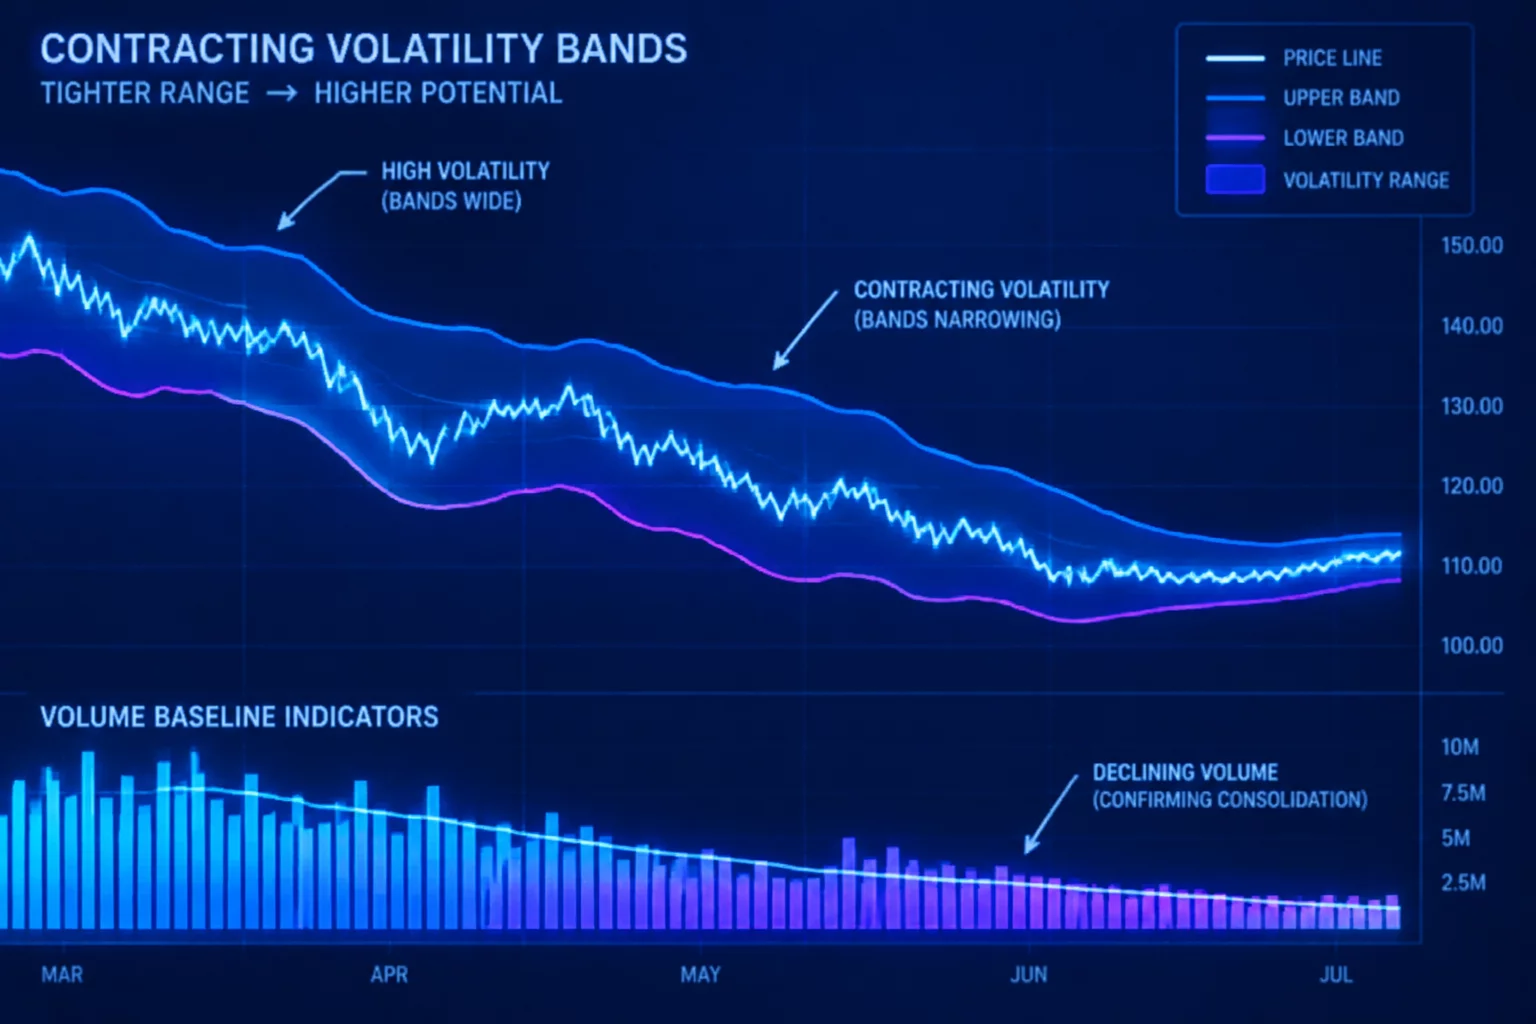
How coupling compression band metrics with rolling liquidity minimums filters out illiquid drift while isolating genuine coiling candidates in equity screening universes.
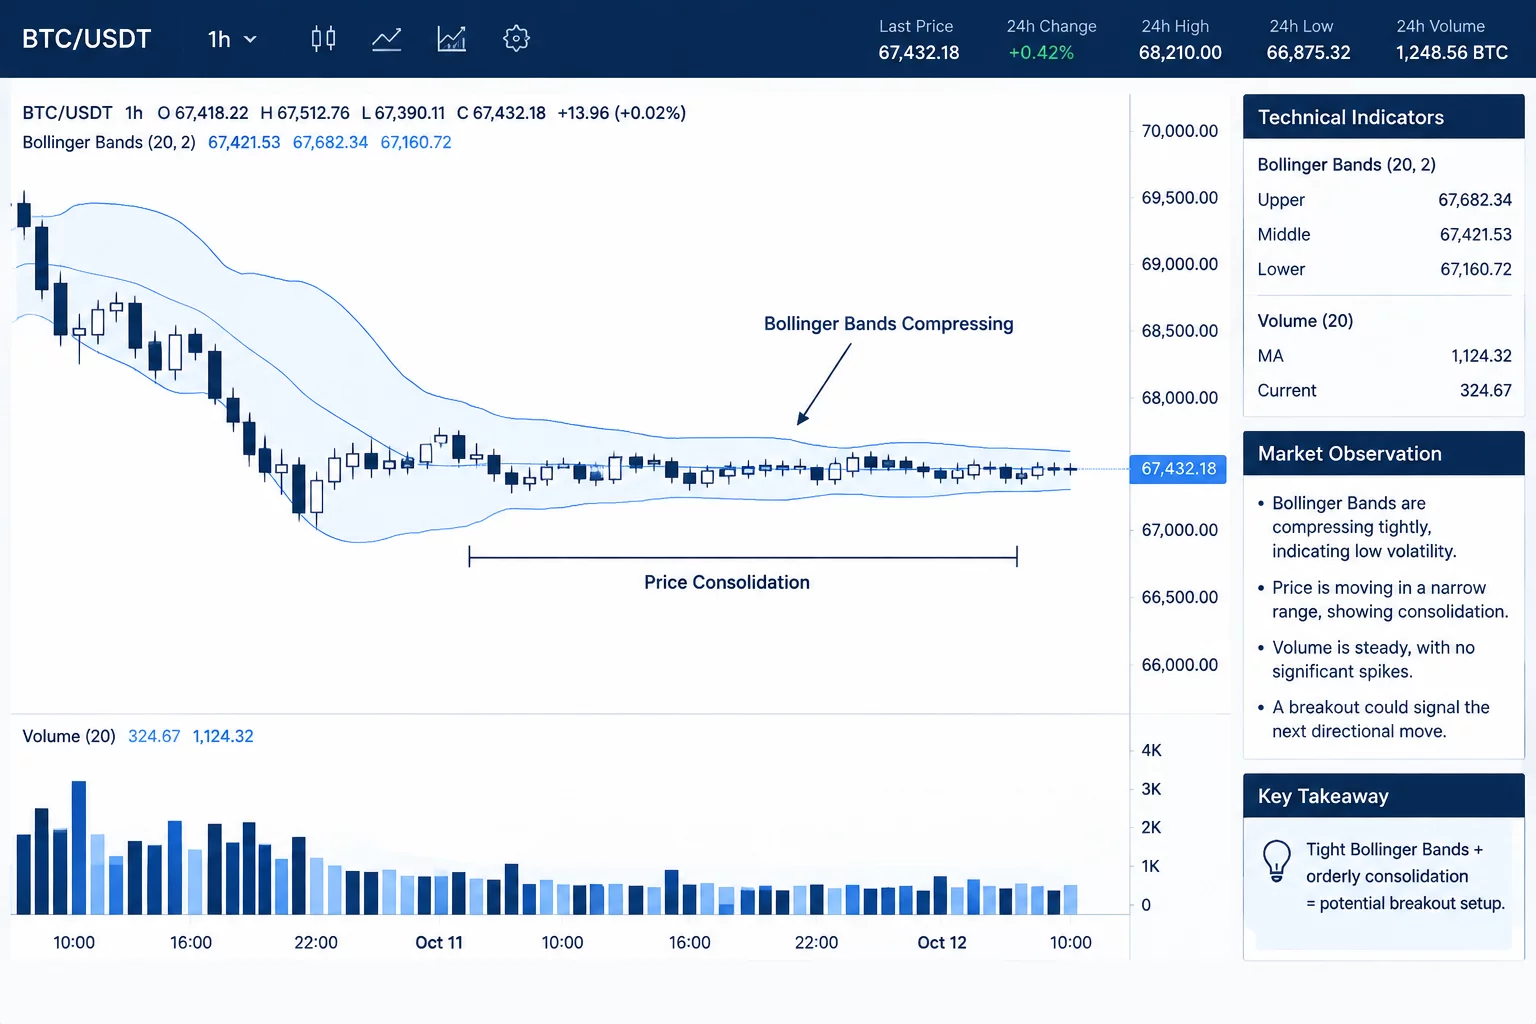
Quantitative screeners frequently isolate low volatility as a precursor to explosive range expansion. However, applying narrow Bollinger Band or Keltner Channel bandwidth criteria across an unfiltered market universe inevitably surfaces hundreds of neglected equities. In thinly traded instruments, band contraction reflects market abandonment rather than energetic coiling. Spreads widen, trading halts occur between sporadic round lots, and printed prices artificially flatten into tight envelopes that deceive naive technical filters.
Establishing a rigid liquidity floor before computing relative compression metrics enforces economic viability. By pruning instruments whose rolling median turnover fails to satisfy institutional absorption thresholds, the screener eliminates false-positive consolidations. The remaining candidates meet the defined turnover and compression thresholds. A review question is whether low volatility reflects regular activity or sparse data; passing the stack alone does not establish accumulation.
Review the exact PCF script formulation pairing Bandwidth(20, 2) thresholds with 50-day average daily dollar volume floors in TC2000.
Calculations must proceed in a deliberate sequence to preserve screening efficiency and semantic fidelity. Processing heavy multi-period indicator calculations on a 10,000-stock universe strains database resources and pollutes the diagnostic log with irrelevant low-float artifacts. When the liquidity floor executes as the primary boundary condition, the scanning engine instantly discards nearly seven thousand instruments before evaluating complex statistical standard deviations.
Once the liquidity baseline establishes a viable trading regime, the band squeeze parameter operates under verified auction conditions. Stocks passing this dual filter represent genuine structural pressure: continuous turnover occurring inside progressively tighter daily ranges. Analysts evaluating the output can focus directly on catalyst proximity and base symmetry rather than filtering out fractional-penny bid-ask artifacts.
A volatility squeeze in an illiquid equity is not potential energy waiting to release; it is simply market inertia where no counterparty exists.
Always mandate rolling turnover and share volume floors prior to testing band width or standard deviation variables.
Normalize band spread by the 20-period moving average price so that higher-priced and low-priced tickers compress on equal mathematical footing.
Incorporate minimum daily price range checks to exclude non-trading sessions and stale print anomalies.
Tell us which condition or sequence you are investigating. Share a question, a correction, or a point that needs a clearer explanation.
Volatility Band Squeeze and Liquidity Floor
Our editorial desk discusses educational screening logic. It does not provide securities recommendations or trade signals.