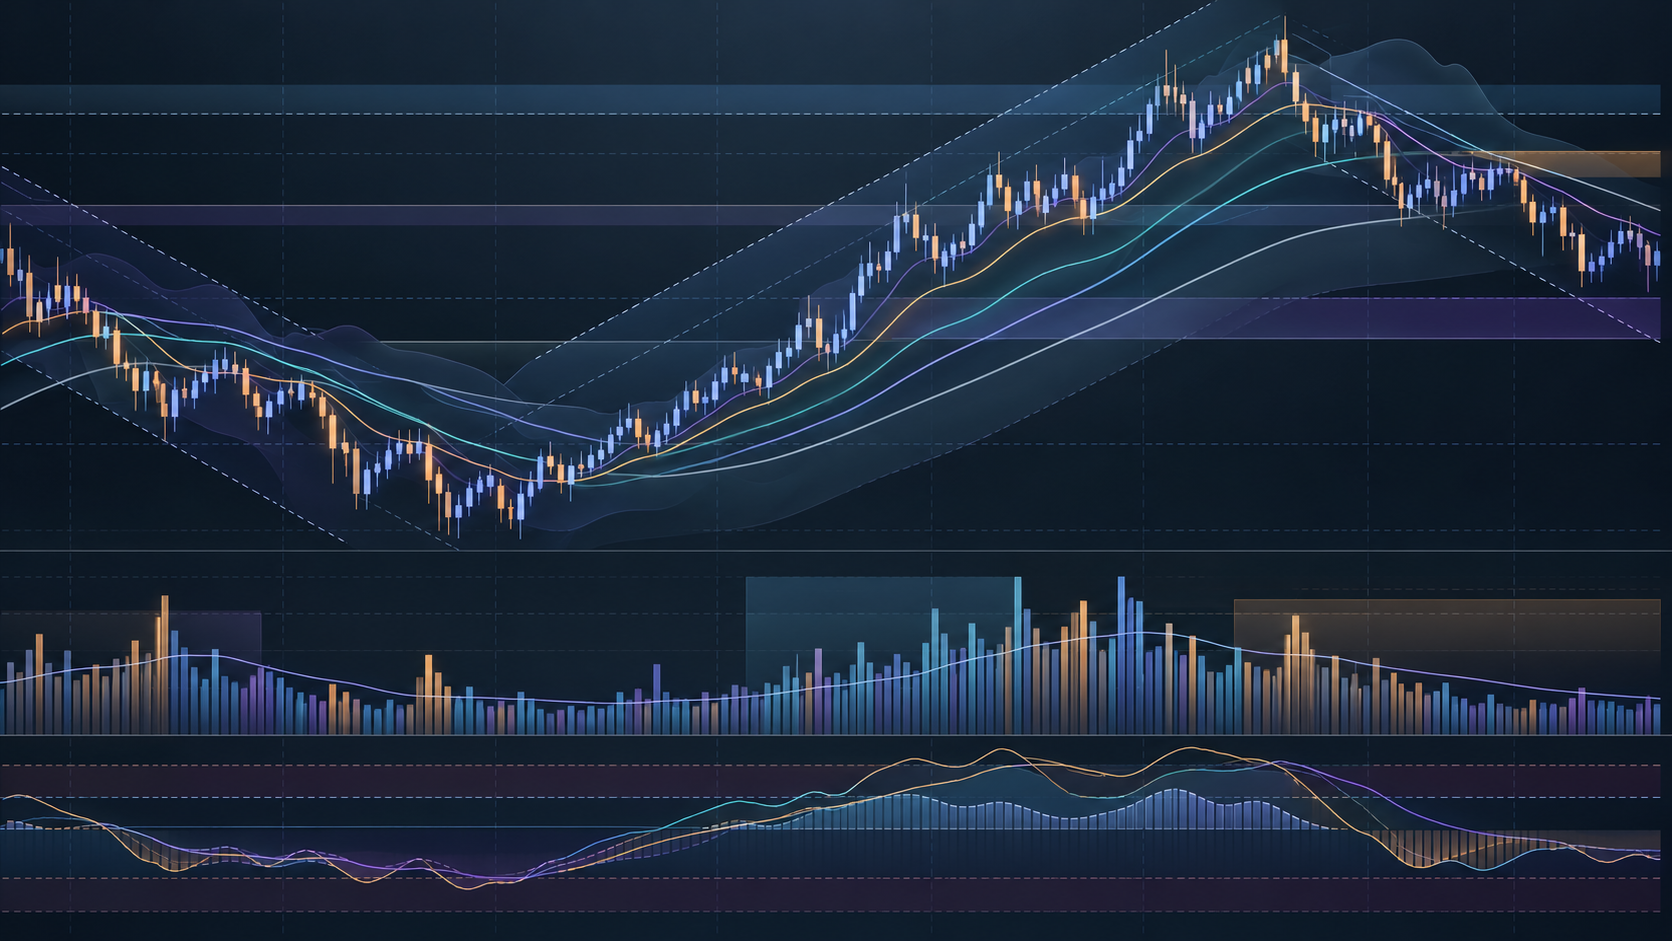
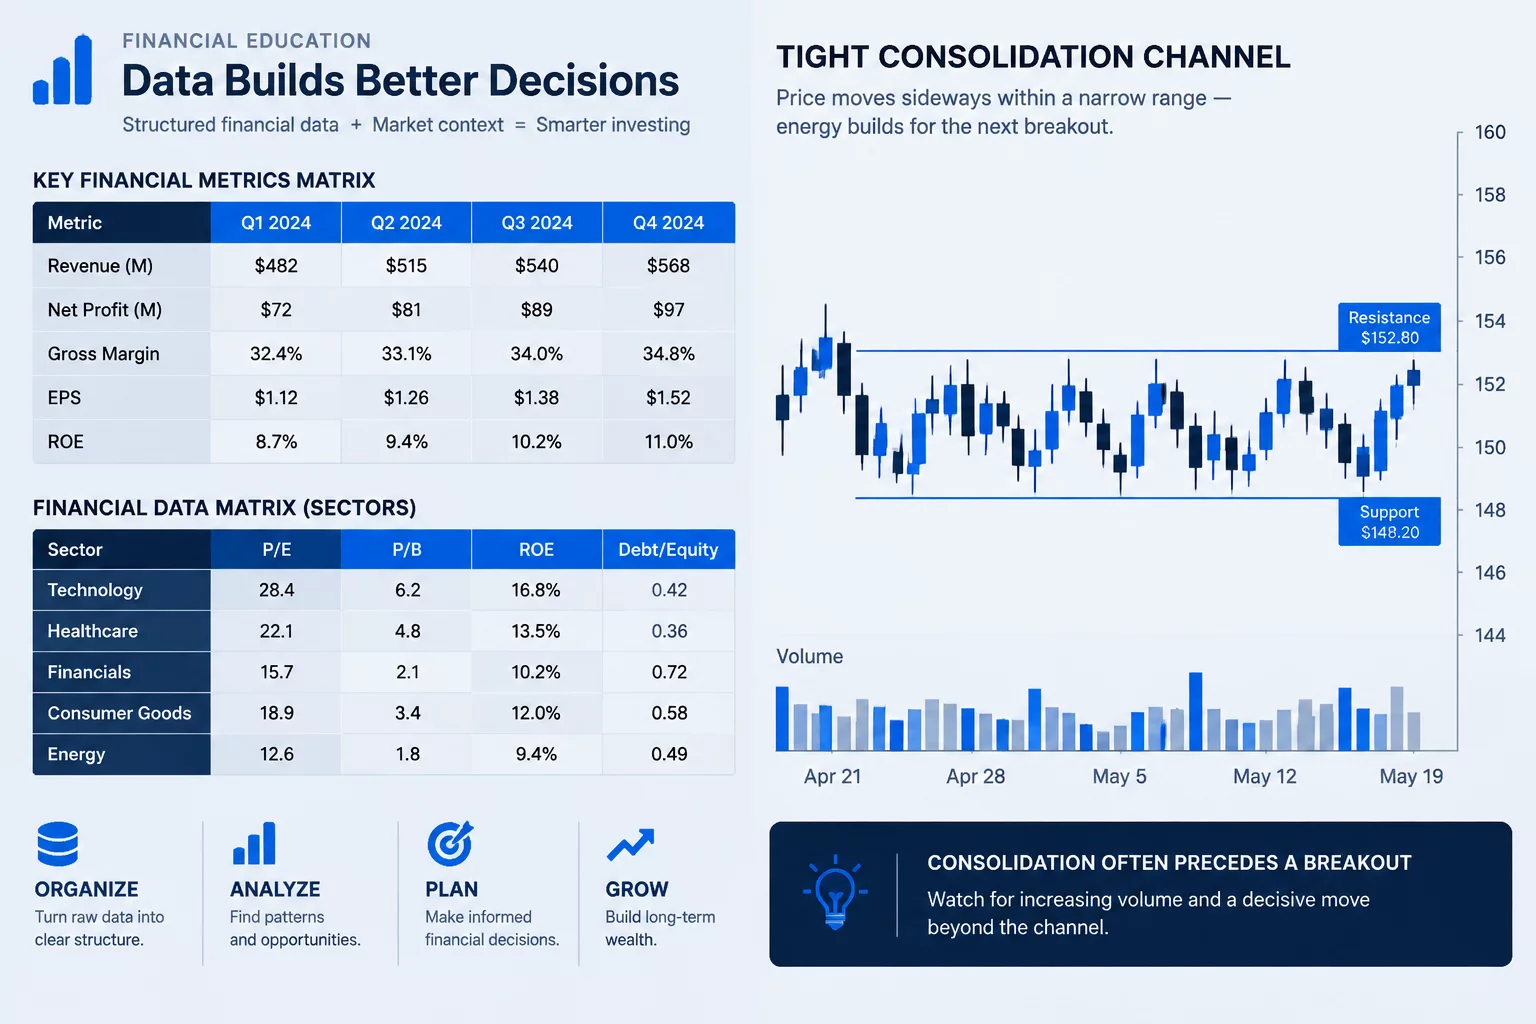
Multi-Factor Trend and Volume Baseline
Constructing persistent trend baselines across multiple timeframes while eliminating illiquid equities before deeper calculation.
A rigorous three-tier filtration sequence combining volatility contraction, multi-week consolidation bounds, and institutional volume confirmation to eliminate market noise without overfitting.
Most market participants approach breakout scanning with an oversimplified rule: identify symbols reaching fresh multi-week highs on higher-than-average volume. Across broad market universes exceeding seven thousand tickers, that singular criteria returns dozens of unworkable candidates each day. A stock expanding past a resistance level after a wild ten-day run is fundamentally exhausted, yet naive single-indicator scans treat it identically to an instrument breaking out cleanly from a quiet, four-week coiled base.
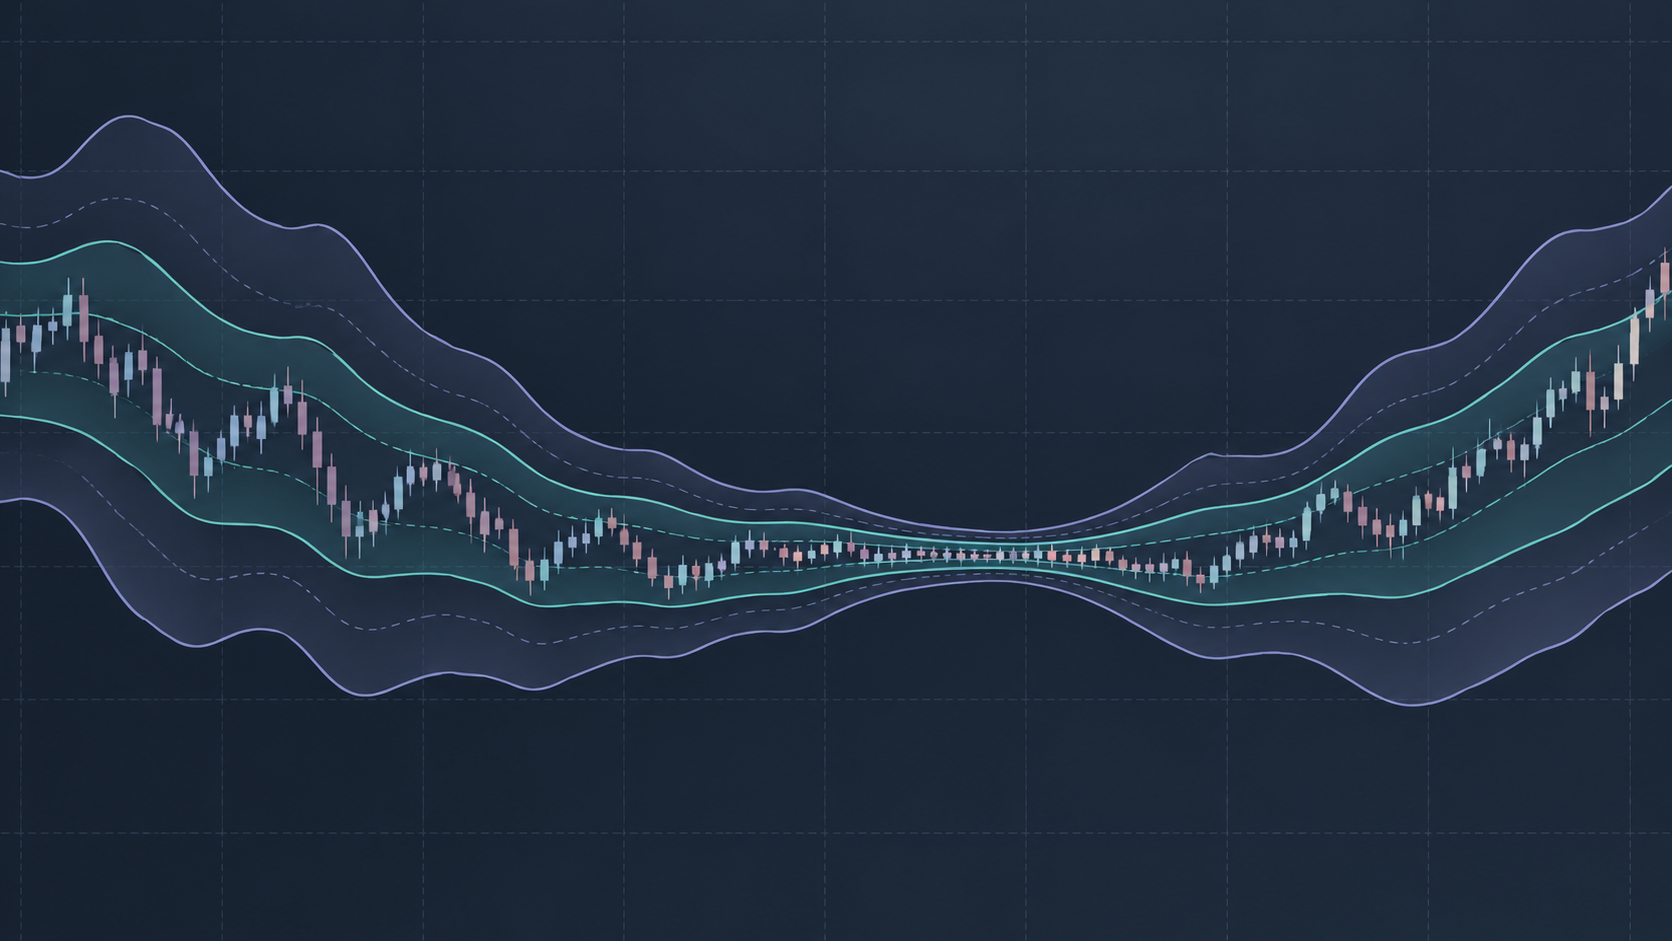
This composite stack introduces an explicit baseline filter sequence. Before the screening engine evaluates whether a price breakout has occurred today, it first interrogates the prior structural regime of the instrument. The pipeline demands that the underlying volatility in the prior twenty trading sessions remained compressed within a narrow structural corridor. By isolating compression first, the subsequent expansion criteria filters out late-stage momentum spikes and leaves a candidate subset that meets the stated compression and expansion rules; these rules do not establish institutional activity or predict a breakout.
Review the syntax guidelines, arithmetic operators, and parameter tuning required to implement this multi-stage condition chain directly inside your local scanning environment.
Traders frequently make the mistake of piling correlated indicators onto a breakout scan, adding RSI overbought thresholds, MACD histogram crossovers, and Bollinger Band stretch conditions into one cluttered query. Because all three measures derive directly from recent closing price history, they provide collinear confirmation without introducing any independent information. When volatility shifts, these redundant calculations fail simultaneously.
The architecture of the Composite Technical Breakout Stack avoids this trap by selecting strictly orthogonal dimensions. Stage 1 addresses pure market structure liquidity. Stage 2 evaluates historical range span independent of momentum direction. Finally, Stage 3 demands real-time participation via trading volume versus its fifty-day baseline. Each component measures a distinct physical reality of auction order flow, leaving fewer than twenty high-probability candidates for post-screen visual audit.
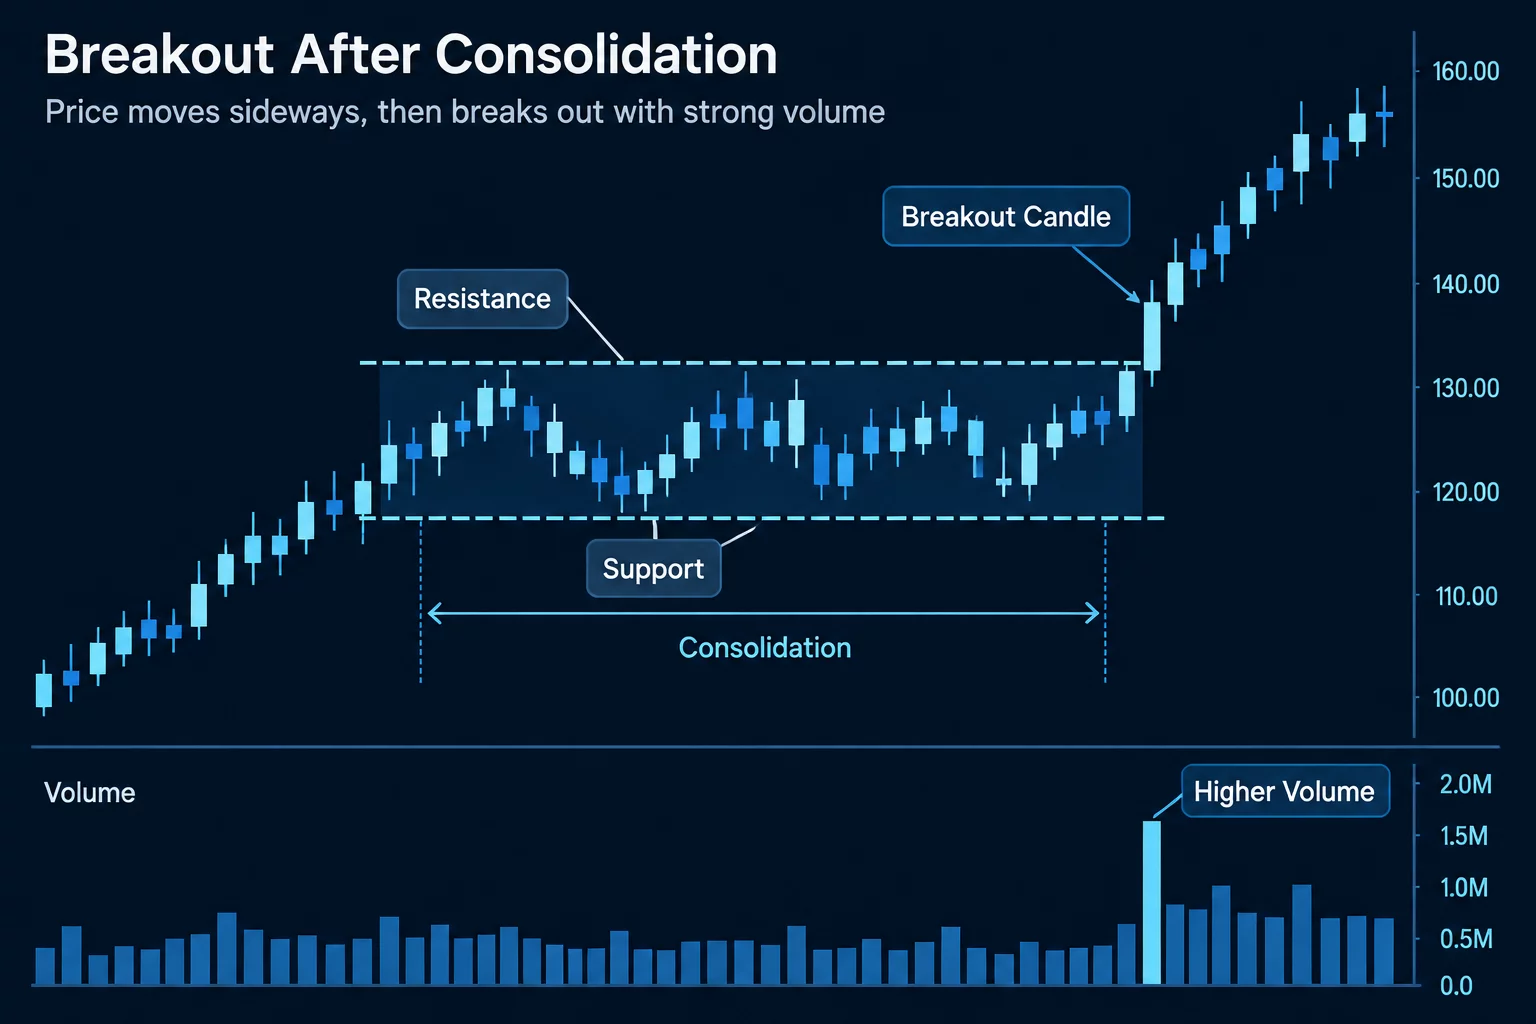
A breakout condition lacking an explicit prior contraction filter simply flags random volatility spikes rather than genuine transitions from equilibrium to trend.
Eliminate already overextended rallies by calculating high-low spreads across the preceding twenty bars before testing today's range expansion.
Measure volume surges against longer fifty-day averages rather than brief windows, ensuring institutional conviction stands apart from retail churn.
Audit the surviving pool for single-industry concentration caused by macro events, preserving cross-sectional breadth across the watch universe.
Tell us which condition or sequence you are investigating. Share a question, a correction, or a point that needs a clearer explanation.
Composite Technical Breakout Condition Stack
Our editorial desk discusses educational screening logic. It does not provide securities recommendations or trade signals.