Sequence Cases

Price Structure Preceding Indicator Calculations

Why evaluating pivot geometry, base consolidation, and clean price distribution before applying derivative oscillators eliminates processing overhead and noisy mathematical artifacts.

2026-09-01 • Elena Rostova • 8 min read • Pipeline Optimization
Price Structure Preceding Indicator Calculations
Sequence Audit
Structural Geometry в†’ Derivative Math
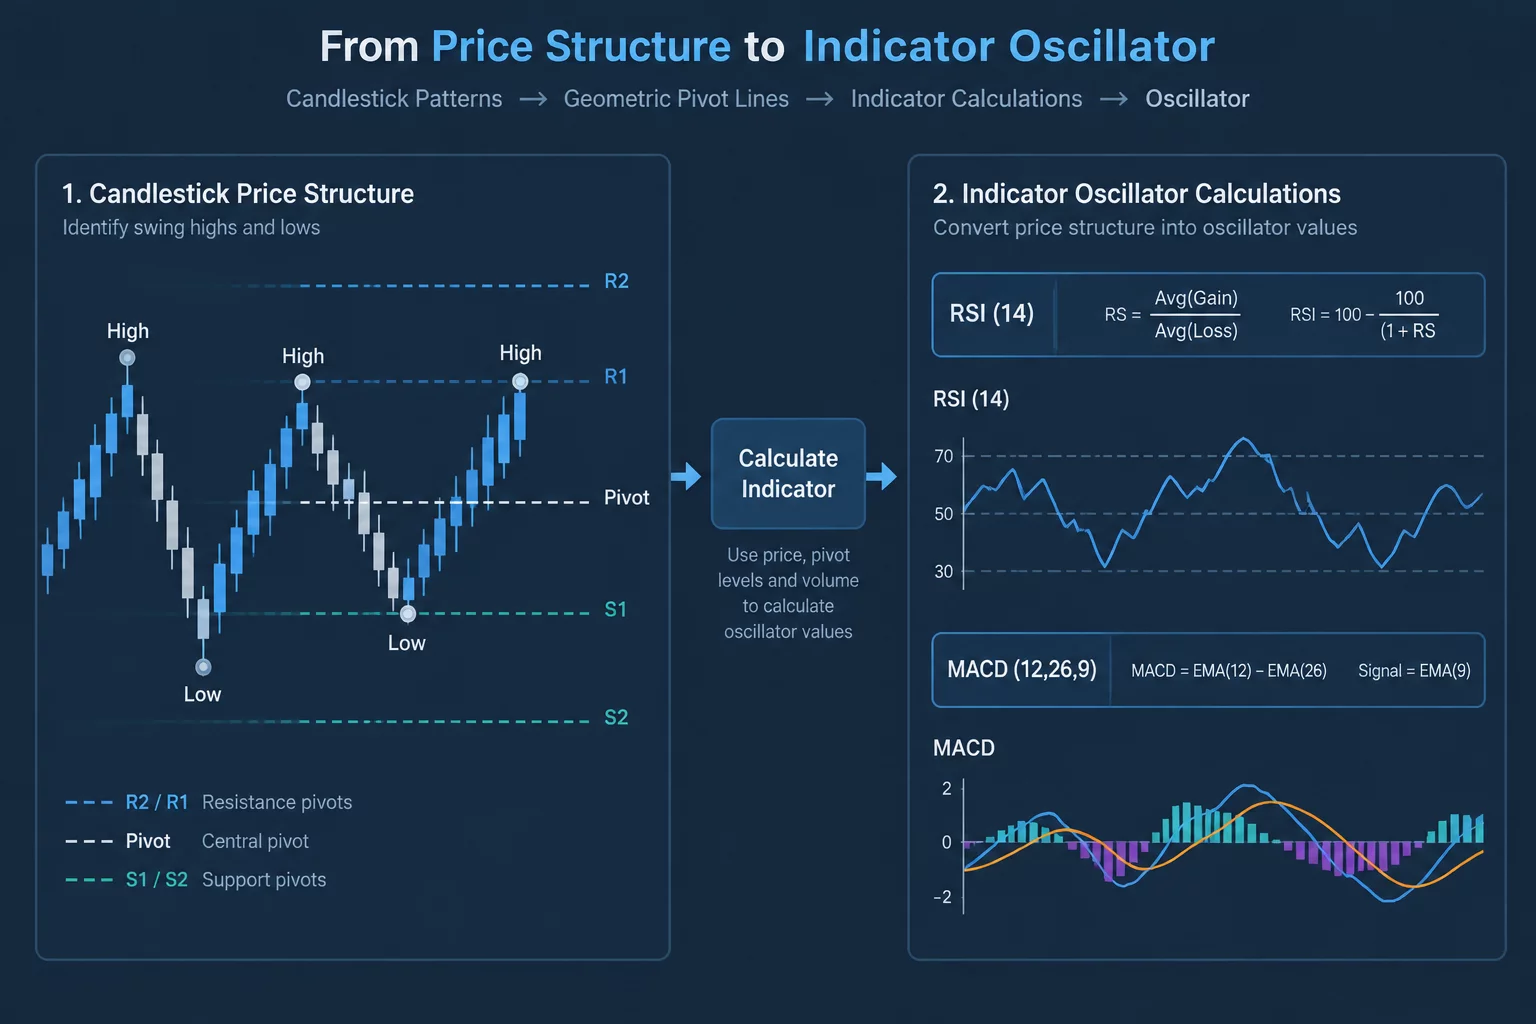
Logic Metrics: Stage 1: Structural Pivot Bounds Stage 2: Spread & Volatility Baseline Stage 3: Oscillator Derivation
In computational stock screening, mathematical indicators are purely functions of underlying price and volume history. When a screening pipeline prioritizes derivative indicators—such as moving average convergences, RSI thresholds, or stochastic bands—ahead of clean price structure verification, it wastes computational resources on erratic, broken charts that happen to trigger transient indicator thresholds.

The Flaw of Derivative-First Screening Architectures

Derivative technical indicators compress multi-period price data into synthetic scalar values. An oversold oscillator reading or a moving average cross can occur during an orderly multi-week base consolidation just as easily as during a catastrophic gap-down liquidation. When screener engines calculate heavy window functions across thousands of symbols before confirming whether the instrument trades within an orderly structural range, they ingest systemic false positives.

In systematic filtering, structural filters serve as sanity gates. Filtering for defined swing highs, higher-low progressions, or distance from significant historical pivot levels discards erratic price action immediately. The compute pipeline never needs to evaluate floating-point smoothing algorithms on charts that fail basic geometric integrity.

Architecture Reference
Multi-Stage Condition Architecture

Explore how cascading filter hierarchies isolate viable consolidation candidates while reducing pipeline execution latency.

Review Filter Logic

Establishing Structural Bounds Prior to Formulaic Transforms

A disciplined filtering hierarchy establishes geometric sanity before applying indicator formulas. This sequential progression ensures each subsequent filter layer operates solely on structurally validated price distributions:

  • Price Boundary Isolation: Verifying price maintains tight containment relative to 20-day and 50-day pivot boundaries before calculating rate-of-change metrics.
  • Clean Bar Spread Check: Confirming true range and spread distribution remain uniform, filtering out erratic single-bar spikes that warp exponential smoothing formulas.
  • Relative Range Contraction: Ensuring daily high-low ranges are narrowing into support rather than expanding violently during liquidation cascades.

Only when these geometric prerequisites pass should secondary indicators enter the screening sequence. An RSI condition evaluated on an already contracted, orderly base provides meaningful contextual momentum. The same RSI condition evaluated without structural boundaries returns noisy, uninvestable penny artifacts or high-beta drift.

Computational Efficiency and False-Positive Compression

Running scans against broad market universes of several thousand tickers requires strict resource allocation. Evaluating basic relational comparisons (such as Close exceeding 90% of a 20-day high) takes trivial CPU cycles compared to multi-period nested exponential equations or stochastic rolling bands. By placing price geometry first, screener query engines cull 75% to 90% of the candidate pool before running computationally demanding transforms.

Analytical Summary

Structural Sequence Takeaways

Structural Geometry Dictates Context

Oscillators and moving averages inherit noise from chaotic charts. Evaluating price structure first eliminates mathematically valid yet contextually uninformative matches.

Compute Pipeline Acceleration

Simple relational price gates eliminate up to 90% of candidate noise upfront, saving processor cycles and delivering cleaner screening candidate sets.

Contributor Profile

Elena Rostova

Elena Rostova is a quantitative workflow analyst specializing in condition chaining, filtering order optimizations, and systematic EasyScan criteria design at ConditionStack Journal.

Step-by-Step Screening Framework

Ready to Audit Your Screening Sequence?

Discover how adjusting condition execution order improves screening speed, reduces false candidates, and preserves structural clarity across market scans.

Sequential Sequence Studies

Complementary Execution Order Studies

Reader Questions & Case Feedback

Ask About This Screening Case

Tell us which condition or sequence you are investigating. Share a question, a correction, or a point that needs a clearer explanation.

Page reference

Price Structure Preceding Indicator Calculations

Our editorial desk discusses educational screening logic. It does not provide securities recommendations or trade signals.

All fields are required. Please keep your question focused on educational screening logic.

ConditionStack Journal В· Editorial Desk

Thank you for your screening question.

Your inquiry has been received along with the page reference. Thank you for helping us make screening logic clearer.