August 8, 2026
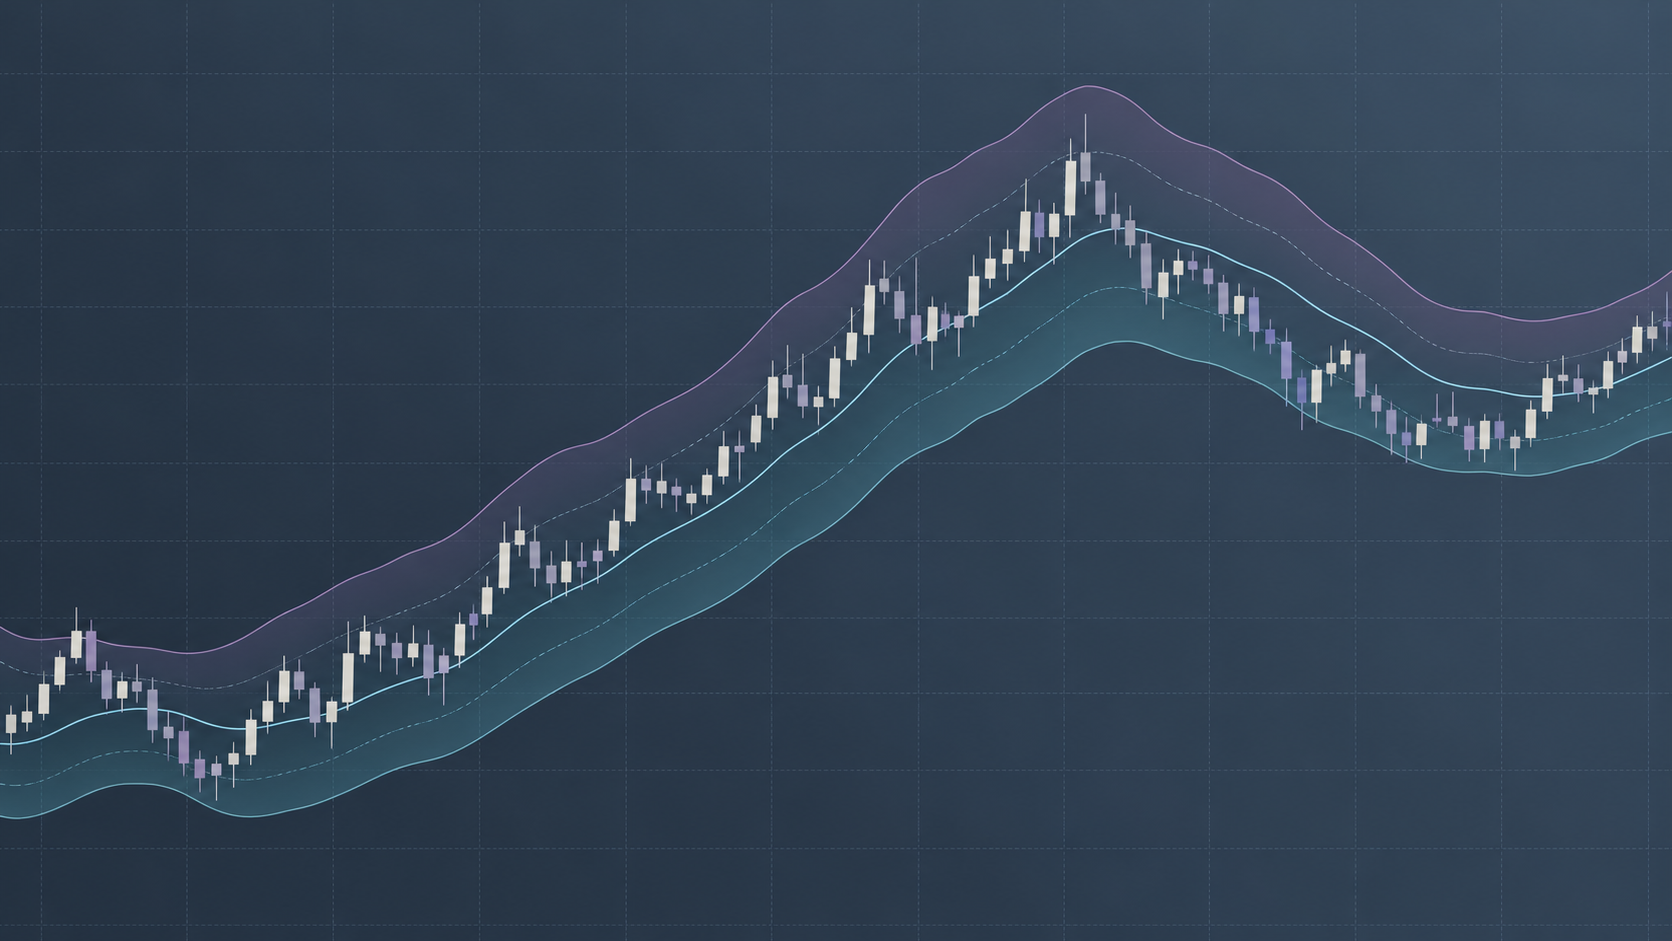
Weekly Moving Average Filters Applied to Daily Universes
Analyzing how weekly trend slopes filter false daily breakouts and reduce churn in broad equity universes.
Read CaseExamining why apparent volume surges on daily charts frequently disguise intraday liquidity vacuums, distorted auction prints, or conflicting interval cadences during quantitative screening.
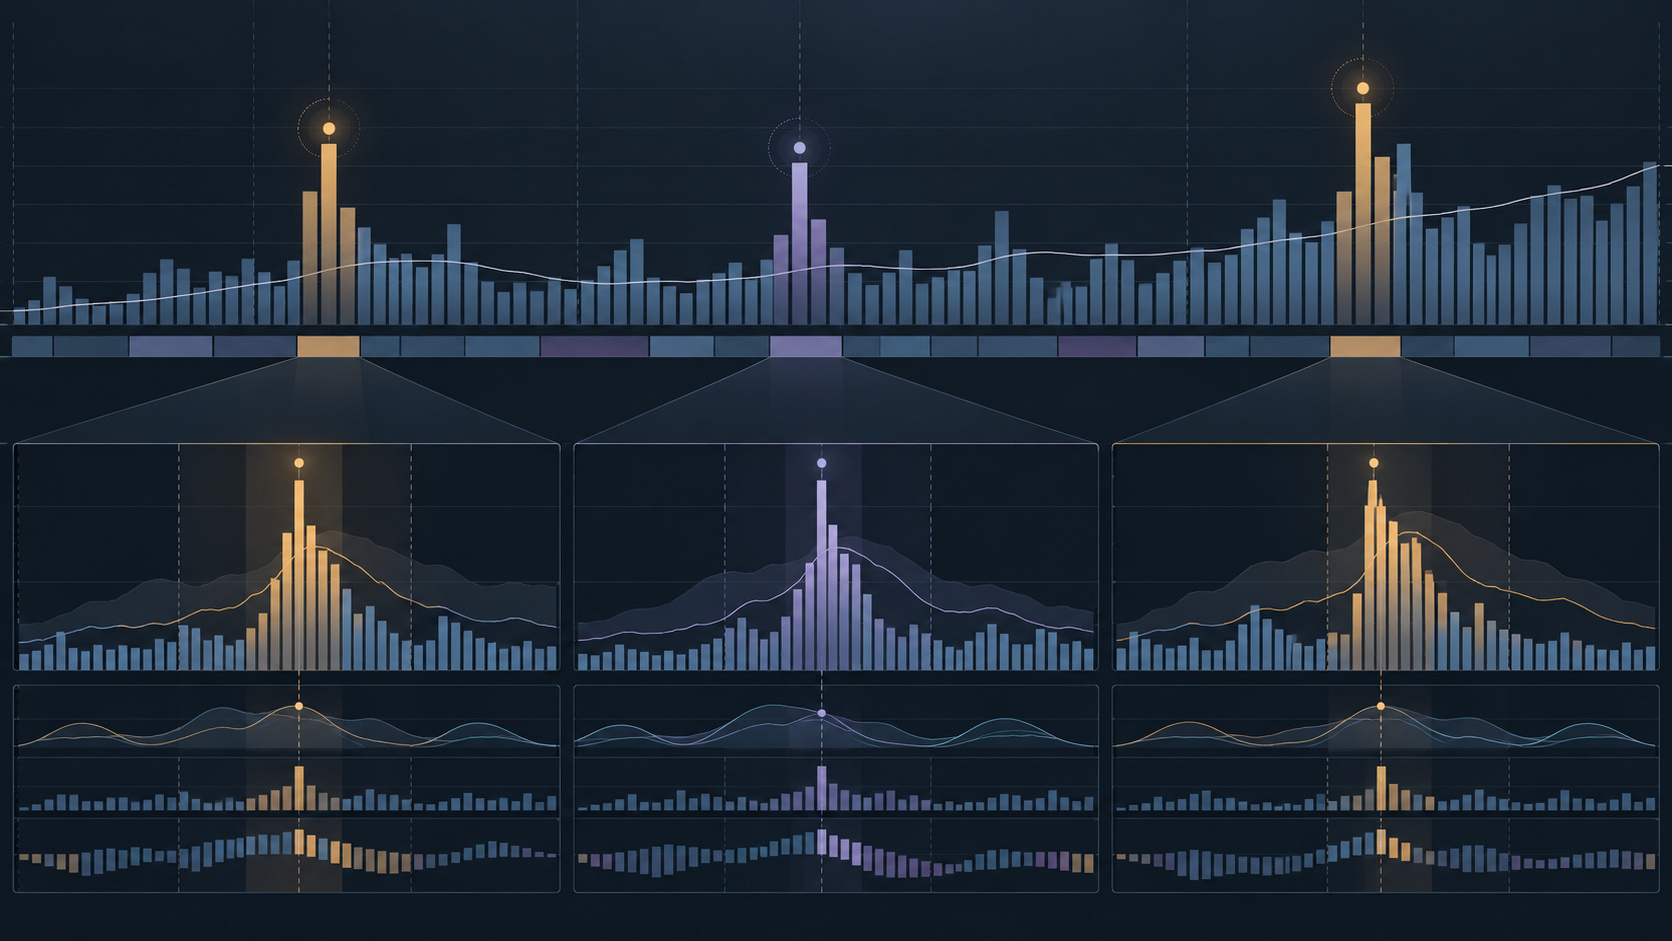
Daily screening scans routinely rely on a simplistic volume threshold—such as a current volume reading exceeding 150% of the 50-day moving average—to confirm directional expansions. When screening logic treats aggregate daily turnover as a monolithic signal, it risks capturing false breakouts driven by isolated single-block trades, opening bell auctions, or closing-cross rebalancing rather than sustained intraday institutional accumulation.
This case investigates the quantitative failure rate when evaluating volume without synchronizing sub-interval metrics. By integrating multi-horizon volume pacing, relative volume distribution across 65-minute segments, and strict session-weighted turnover filters, screeners isolate true participation across multiple timeframe horizons rather than mechanical reporting anomalies.
The screener starts with an initial liquid universe of active equities (average daily volume > 750,000 shares) and flags instruments printing a daily volume surge (Volume >= 2.0 * Volume_SMA(50)). While this stage captures 142 candidates across the broad equity index, manual inspection indicates that over half experienced localized volume spikes during the opening auction, followed by an immediate return to below-average liquidity during mid-day trade.
To prevent auction distortion, the candidate pool is partitioned through 65-minute interval checks. A genuine trend expansion typically distributes volume across at least three distinct session segments, whereas anomalous prints concentrate greater than 60% of total volume into a single 15-minute or 65-minute window without subsequent price expansion. Candidates showing extreme volume clustering in a solitary bar are rejected.
Evaluating daily volume mid-session produces chronological skew. At 11:00 AM EST, an instrument cannot be evaluated against an end-of-day SMA. The screening condition introduces a historical time-of-day pace curve: relative volume is benchmarked against the historical median cumulative volume achieved by that exact minute over the prior 20 sessions. This prevents false negatives early in the morning and false positives late in the session.
High volume accompanied by narrow price range indicates churning or heavy institutional absorption rather than clean directional momentum. The final filtration step couples the volume pacing rule with an Average True Range expansion condition on both the 1-day bar and 5-minute bars. Out of 142 initial candidates, exactly 11 instruments satisfy both daily expansion and persistent intraday range expansion with confirmed volume spread.
Analyzing how weekly trend slopes filter false daily breakouts and reduce churn in broad equity universes.
Read Case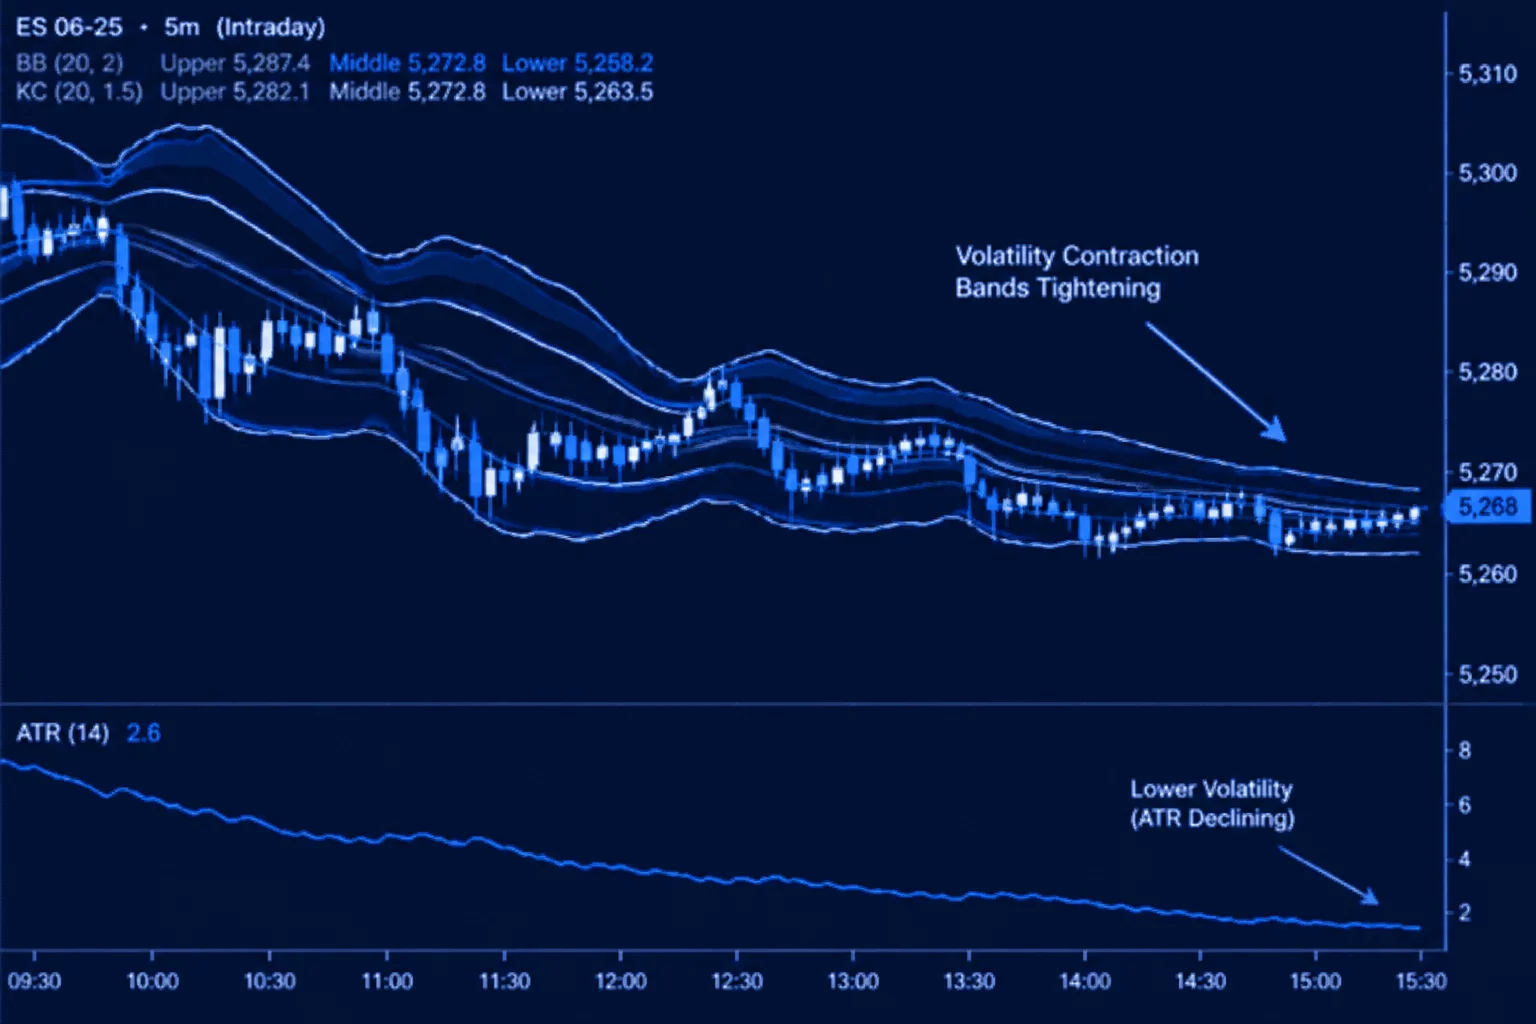
Combining 15-minute volatility contraction indicators with daily trend momentum for clean scan candidate lists.
Read Case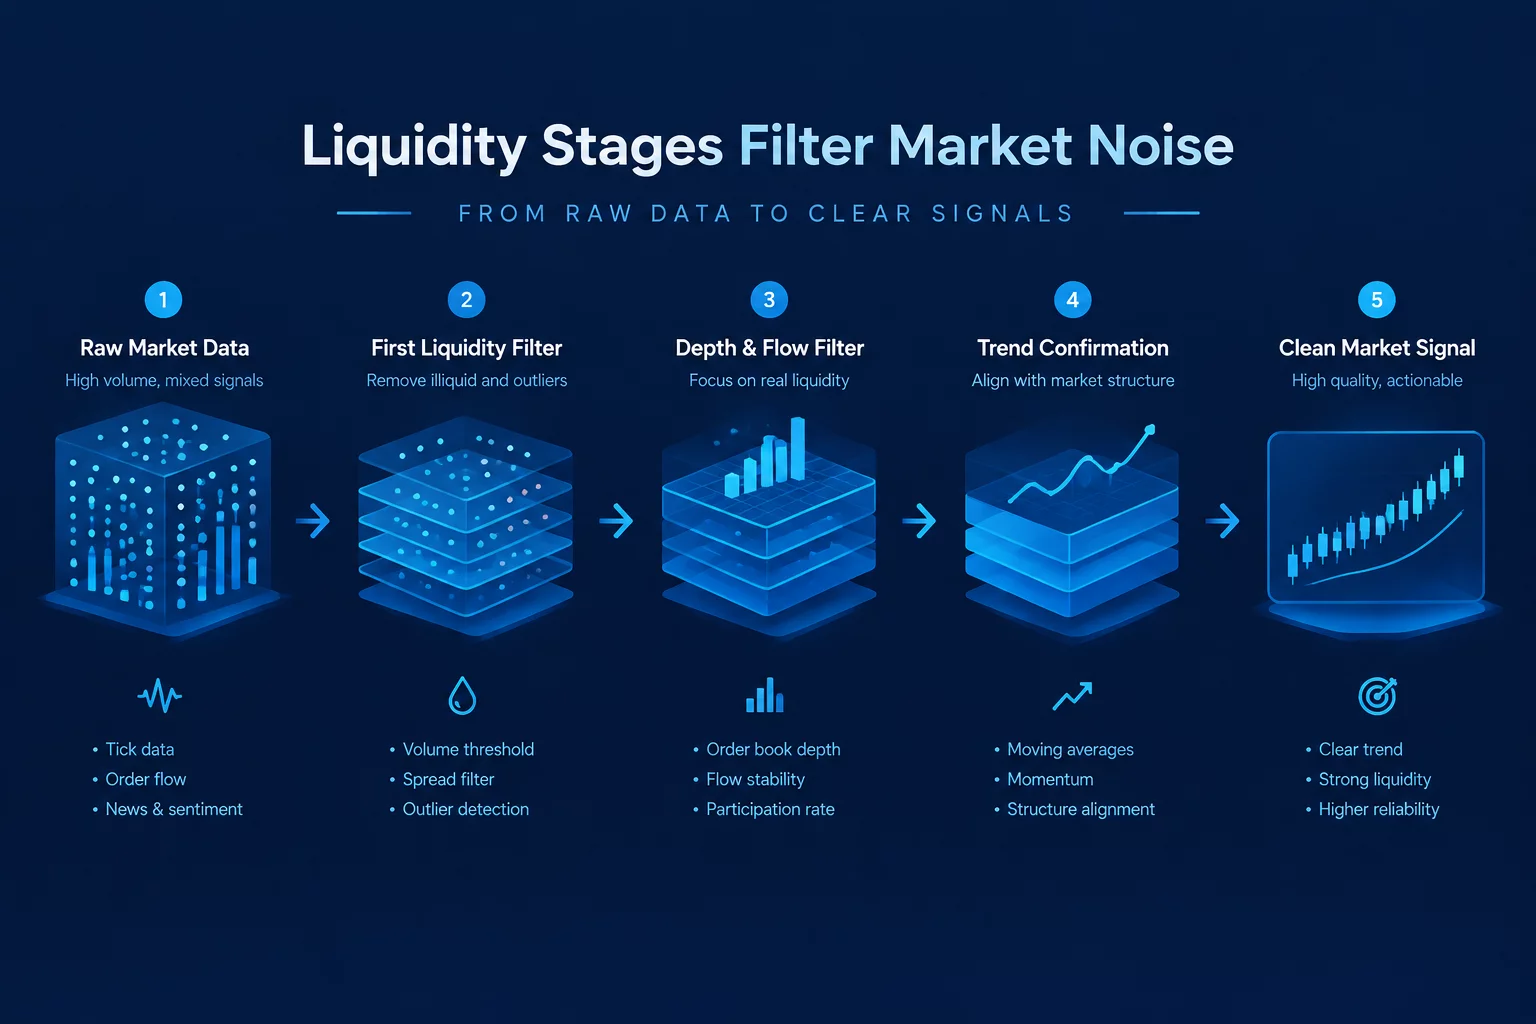
Why pre-filtering by dollar volume and turnover avoids erratic indicator readings on thinly traded instruments.
Read Case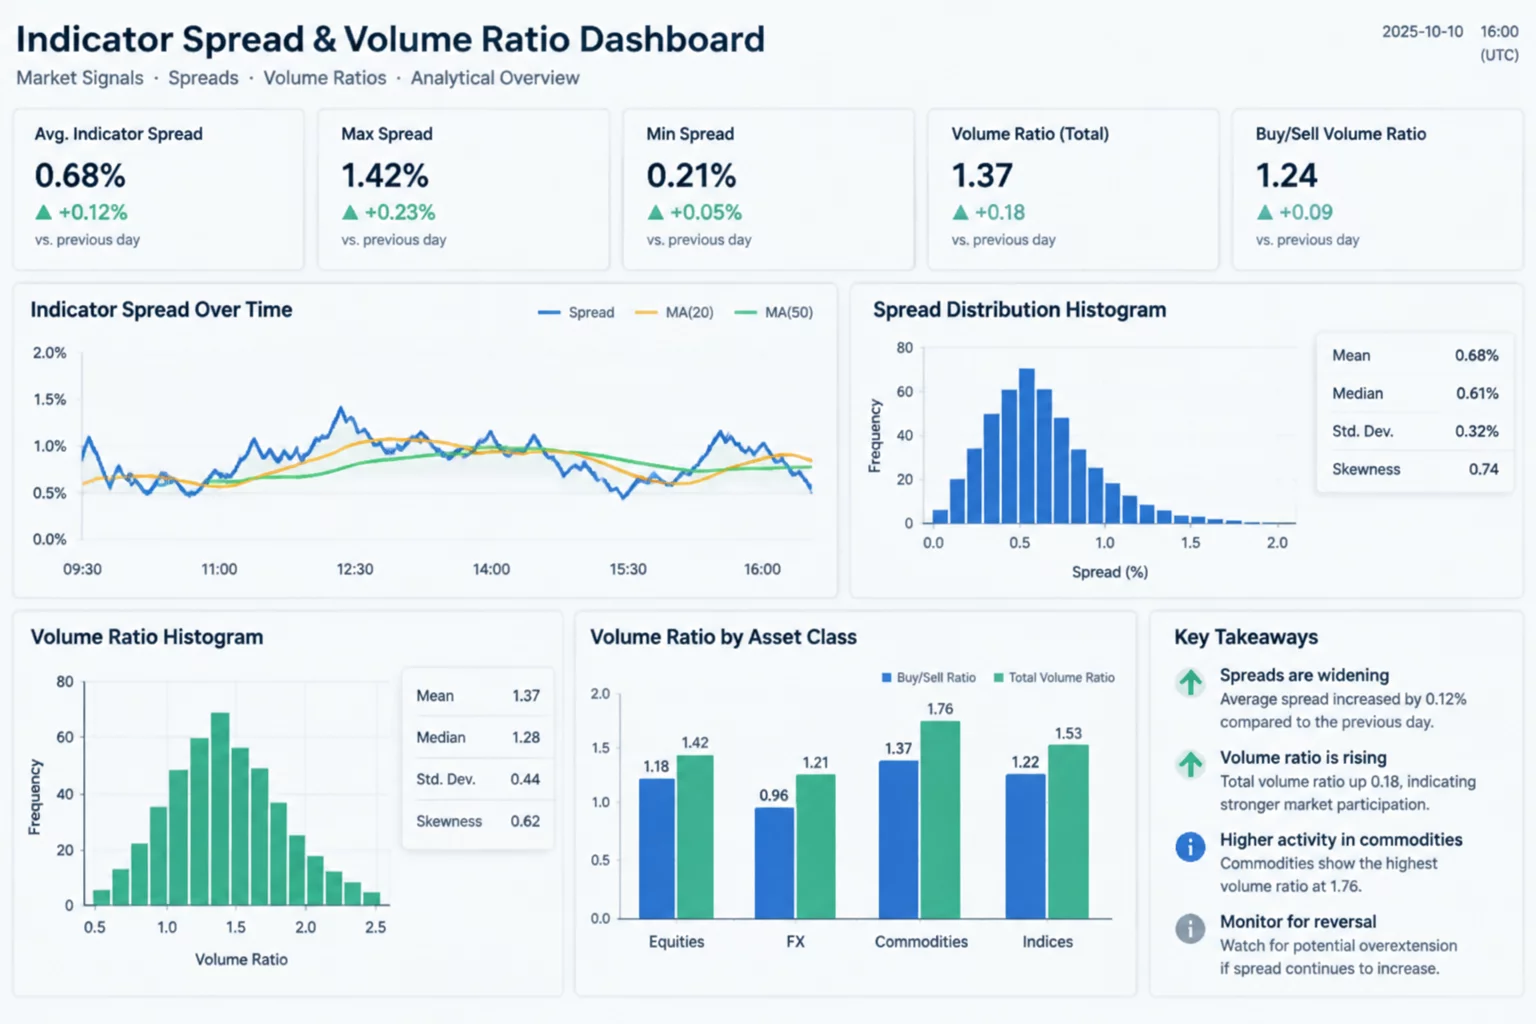
A multi-factor condition stack isolating healthy price spread expansion backed by consistent relative volume metrics.
Read CaseTell us which condition or sequence you are investigating. Share a question, a correction, or a point that needs a clearer explanation.
Multi-Timeframe Volume Confirmation Anomalies
Our editorial desk discusses educational screening logic. It does not provide securities recommendations or trade signals.